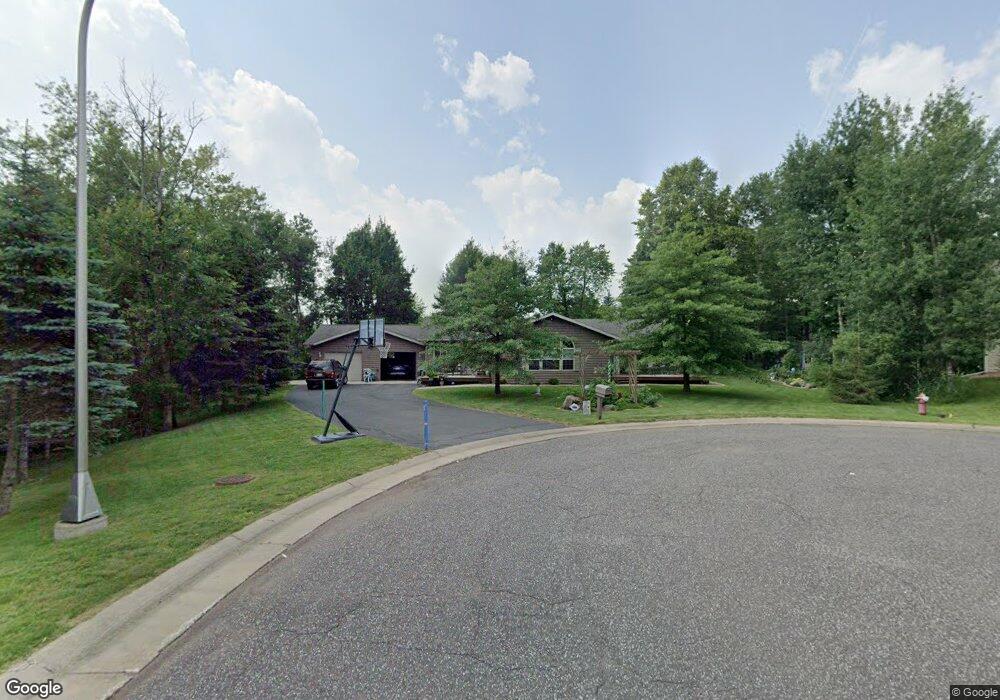
826 Lupine Dr Proctor, MN 55810
Estimated Value: $414,651 - $646,000
3
Beds
3
Baths
2,016
Sq Ft
$243/Sq Ft
Est. Value
About This Home
This home is located at 826 Lupine Dr, Proctor, MN 55810 and is currently estimated at $489,163, approximately $242 per square foot. 826 Lupine Dr is a home located in St. Louis County with nearby schools including Bay View Elementary School, Jedlicka Middle School, and Proctor Senior High School.
Ownership History
Date
Name
Owned For
Owner Type
Purchase Details
Closed on
Dec 14, 2005
Sold by
Easy Housing Of Duluth Inc
Bought by
Madson Eric L and Madson Debra M
Current Estimated Value
Home Financials for this Owner
Home Financials are based on the most recent Mortgage that was taken out on this home.
Original Mortgage
$234,352
Outstanding Balance
$131,835
Interest Rate
6.48%
Mortgage Type
Fannie Mae Freddie Mac
Estimated Equity
$357,328
Create a Home Valuation Report for This Property
The Home Valuation Report is an in-depth analysis detailing your home's value as well as a comparison with similar homes in the area
Home Values in the Area
Average Home Value in this Area
Purchase History
| Date | Buyer | Sale Price | Title Company |
|---|---|---|---|
| Madson Eric L | $293,000 | Pioneer Abst |
Source: Public Records
Mortgage History
| Date | Status | Borrower | Loan Amount |
|---|---|---|---|
| Open | Madson Eric L | $234,352 |
Source: Public Records
Tax History
| Year | Tax Paid | Tax Assessment Tax Assessment Total Assessment is a certain percentage of the fair market value that is determined by local assessors to be the total taxable value of land and additions on the property. | Land | Improvement |
|---|---|---|---|---|
| 2024 | $4,988 | $367,100 | $39,900 | $327,200 |
| 2023 | $4,988 | $329,100 | $33,000 | $296,100 |
| 2022 | $4,778 | $300,400 | $33,000 | $267,400 |
| 2021 | $4,434 | $282,000 | $30,400 | $251,600 |
| 2020 | $4,288 | $276,200 | $29,900 | $246,300 |
| 2019 | $3,514 | $264,800 | $29,900 | $234,900 |
| 2018 | $3,588 | $225,300 | $50,400 | $174,900 |
| 2017 | $3,272 | $225,300 | $50,400 | $174,900 |
| 2016 | $3,048 | $213,500 | $50,400 | $163,100 |
| 2015 | $2,647 | $183,800 | $43,500 | $140,300 |
| 2014 | $2,647 | $177,300 | $38,500 | $138,800 |
Source: Public Records
Map
Nearby Homes
- 408 Summit Ave
- 1086 U S Highway 2
- 3224 Lindahl Rd
- 502 3rd Ave
- 8 4th St
- 1010 Bass Blvd
- TBD Meadow St
- 421 Saint Louis River Rd
- 63 S Elder Dr
- 2 Dewberry Ln
- 42 S Elder Dr
- 48 Arbutus Dr
- 93xx W Skyline Pkwy
- 21 Kalmia Dr
- 33 Ivy Dr
- 9119 W Skyline Pkwy
- 30xx N 81st Ave W
- 26xx N 77th Ave W
- 5493 Old Highway 61
- 51xxx Wagner Rd
Your Personal Tour Guide
Ask me questions while you tour the home.