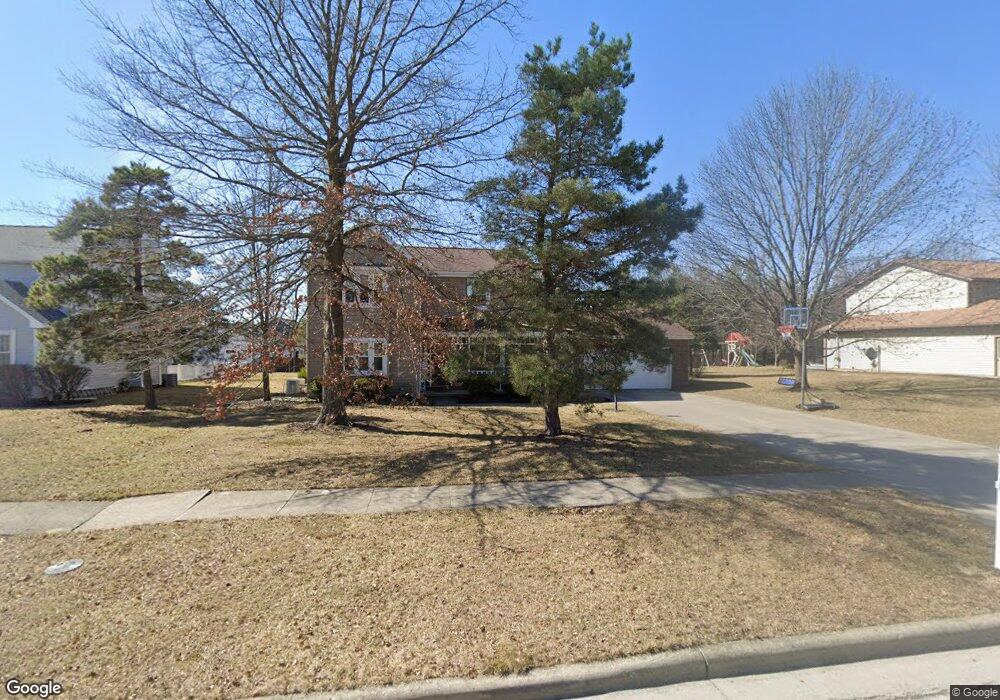
826 Nutmeg Ln Findlay, OH 45840
Estimated Value: $335,000 - $402,000
4
Beds
3
Baths
2,184
Sq Ft
$166/Sq Ft
Est. Value
About This Home
This home is located at 826 Nutmeg Ln, Findlay, OH 45840 and is currently estimated at $361,725, approximately $165 per square foot. 826 Nutmeg Ln is a home located in Hancock County with nearby schools including Van Buren Elementary School, Van Buren Middle School, and Van Buren High School.
Ownership History
Date
Name
Owned For
Owner Type
Purchase Details
Closed on
May 16, 2011
Sold by
Bresler Mark S and Bresler Lesley A
Bought by
Finley John L and Finley Brenda R
Current Estimated Value
Home Financials for this Owner
Home Financials are based on the most recent Mortgage that was taken out on this home.
Original Mortgage
$137,500
Outstanding Balance
$95,688
Interest Rate
4.91%
Mortgage Type
New Conventional
Estimated Equity
$266,037
Purchase Details
Closed on
Jan 8, 2001
Sold by
Denman Dick W
Bought by
Bresler Mark S and Bresler Lesley A
Home Financials for this Owner
Home Financials are based on the most recent Mortgage that was taken out on this home.
Original Mortgage
$100,000
Interest Rate
7.77%
Mortgage Type
New Conventional
Purchase Details
Closed on
Nov 24, 1989
Bought by
Denman Dick W and Denman Karen K
Purchase Details
Closed on
Jul 22, 1987
Bought by
Manley W R Co
Create a Home Valuation Report for This Property
The Home Valuation Report is an in-depth analysis detailing your home's value as well as a comparison with similar homes in the area
Home Values in the Area
Average Home Value in this Area
Purchase History
| Date | Buyer | Sale Price | Title Company |
|---|---|---|---|
| Finley John L | $202,500 | Mid Am Title | |
| Bresler Mark S | $185,500 | -- | |
| Denman Dick W | $150,000 | -- | |
| Manley W R Co | -- | -- |
Source: Public Records
Mortgage History
| Date | Status | Borrower | Loan Amount |
|---|---|---|---|
| Open | Finley John L | $137,500 | |
| Closed | Bresler Mark S | $100,000 |
Source: Public Records
Tax History
| Year | Tax Paid | Tax Assessment Tax Assessment Total Assessment is a certain percentage of the fair market value that is determined by local assessors to be the total taxable value of land and additions on the property. | Land | Improvement |
|---|---|---|---|---|
| 2024 | $2,951 | $94,500 | $15,690 | $78,810 |
| 2023 | $2,936 | $94,500 | $15,690 | $78,810 |
| 2022 | $2,937 | $94,500 | $15,690 | $78,810 |
| 2021 | $2,790 | $84,770 | $15,090 | $69,680 |
| 2020 | $2,787 | $84,770 | $15,090 | $69,680 |
| 2019 | $2,888 | $84,770 | $15,090 | $69,680 |
| 2018 | $2,539 | $73,710 | $13,120 | $60,590 |
| 2017 | $1,274 | $73,710 | $13,120 | $60,590 |
| 2016 | $2,478 | $73,710 | $13,120 | $60,590 |
| 2015 | $2,355 | $68,790 | $13,120 | $55,670 |
| 2014 | $2,365 | $68,790 | $13,120 | $55,670 |
| 2012 | $2,571 | $68,790 | $13,120 | $55,670 |
Source: Public Records
Map
Nearby Homes
- 845 Fox Run Rd Unit 1
- 827 Abbey Ln
- 821 Fox Run Rd Unit 6
- 801 Fox Run Rd
- 701 Red Fox Rd
- 2245 Fox Run Cir Unit 1037
- 1121 Fox Run Rd
- 1926 Queenswood Dr
- 2000 Rush Creek Ct
- 1203 Chateau Ct
- 2143 Bluestone Dr
- 456 Strathaven Dr
- 15329 E Us Route 224
- 0 E Us Route 224
- 1825 Greendale Ave
- 1801 Manor Hill Rd Unit 7
- 1828 Queenswood Dr
- 1448 Eastshore Dr
- 1813 Manor Hill Rd Unit 10
- 8131 Brookfield Cir
- 830 Nutmeg Ln
- 822 Nutmeg Ln
- 2216 Lonetree Dr
- 834 Nutmeg Ln
- 827 Nutmeg Ln
- 831 Nutmeg Ln
- 823 Nutmeg Ln
- 2212 Lonetree Dr
- 2210 Lonetree Dr
- 835 Nutmeg Ln
- 2219 Lonetree Dr
- 2223 Lonetree Dr
- 2215 Lonetree Dr
- 838 Nutmeg Ln
- 2301 Lonetree Dr
- 2211 Lonetree Dr
- 2201 Chestnut Ln
- 839 Nutmeg Ln
- 824 Bitterbrush Ln
- 820 Bitterbrush Ln
Your Personal Tour Guide
Ask me questions while you tour the home.