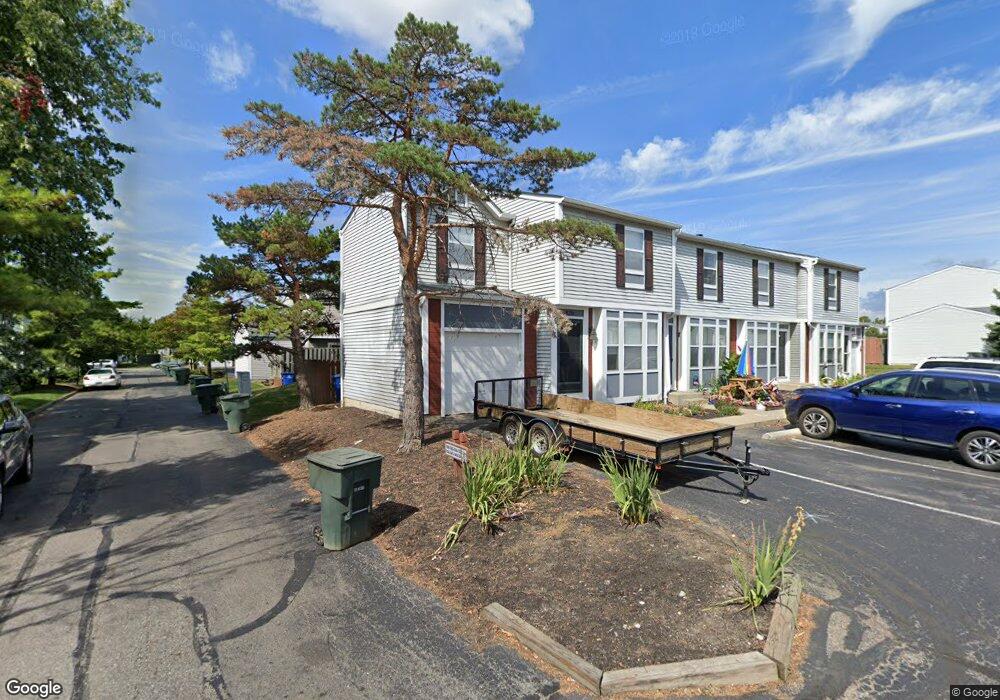
826 Pineway Dr Columbus, OH 43085
Slate Hill NeighborhoodEstimated Value: $202,000 - $220,457
3
Beds
2
Baths
1,108
Sq Ft
$191/Sq Ft
Est. Value
About This Home
This home is located at 826 Pineway Dr, Columbus, OH 43085 and is currently estimated at $211,114, approximately $190 per square foot. 826 Pineway Dr is a home located in Franklin County with nearby schools including Worthington Estates Elementary School, Worthingway Middle School, and Thomas Worthington High School.
Ownership History
Date
Name
Owned For
Owner Type
Purchase Details
Closed on
Sep 12, 2020
Sold by
Grether Eric
Bought by
Wong Hong F
Current Estimated Value
Home Financials for this Owner
Home Financials are based on the most recent Mortgage that was taken out on this home.
Original Mortgage
$108,000
Outstanding Balance
$94,780
Interest Rate
2.8%
Mortgage Type
New Conventional
Estimated Equity
$116,334
Purchase Details
Closed on
Oct 29, 2004
Sold by
Kellogg Gina D
Bought by
Grether Eric
Home Financials for this Owner
Home Financials are based on the most recent Mortgage that was taken out on this home.
Original Mortgage
$99,900
Interest Rate
5.5%
Mortgage Type
Adjustable Rate Mortgage/ARM
Purchase Details
Closed on
Apr 28, 1997
Sold by
Tompkins Paul E and Tompkins Nancy J
Bought by
Kellogg Gina D
Purchase Details
Closed on
May 6, 1993
Purchase Details
Closed on
May 3, 1993
Create a Home Valuation Report for This Property
The Home Valuation Report is an in-depth analysis detailing your home's value as well as a comparison with similar homes in the area
Home Values in the Area
Average Home Value in this Area
Purchase History
We collect this data history from publicly available records. To have your information removed, we recommend requesting removal directly through your county’s website.
| Date | Buyer | Sale Price | Title Company |
|---|---|---|---|
| Wong Hong F | $135,000 | Northwest Ttl Fam Of Compani | |
| Grether Eric | $99,900 | Chicago Tit | |
| Kellogg Gina D | $72,000 | Chicago Title West | |
| -- | -- | -- | |
| -- | -- | -- |
Source: Public Records
Mortgage History
We collect this data history from publicly available records. To have your information removed, we recommend requesting removal directly through your county’s website.
| Date | Status | Borrower | Loan Amount |
|---|---|---|---|
| Open | Wong Hong F | $108,000 | |
| Previous Owner | Grether Eric | $99,900 |
Source: Public Records
Tax History
| Year | Tax Paid | Tax Assessment Tax Assessment Total Assessment is a certain percentage of the fair market value that is determined by local assessors to be the total taxable value of land and additions on the property. | Land | Improvement |
|---|---|---|---|---|
| 2025 | $3,619 | $58,940 | $14,350 | $44,590 |
| 2024 | $3,619 | $58,940 | $14,350 | $44,590 |
| 2023 | $3,460 | $58,940 | $14,350 | $44,590 |
| 2022 | $3,199 | $43,230 | $4,410 | $38,820 |
| 2021 | $2,951 | $43,230 | $4,410 | $38,820 |
| 2020 | $2,702 | $41,090 | $4,410 | $36,680 |
| 2019 | $2,495 | $34,240 | $3,680 | $30,560 |
| 2018 | $2,189 | $34,240 | $3,680 | $30,560 |
| 2017 | $2,236 | $34,240 | $3,680 | $30,560 |
| 2016 | $1,961 | $27,620 | $4,550 | $23,070 |
| 2015 | $1,961 | $27,620 | $4,550 | $23,070 |
| 2014 | $1,961 | $27,620 | $4,550 | $23,070 |
| 2013 | $1,083 | $30,660 | $5,040 | $25,620 |
Source: Public Records
Map
Nearby Homes
- 912 Worthington Woods Blvd Unit 10
- 910 Annagladys Dr Unit G2
- 927 Annagladys Dr Unit W3
- 777 Ficus Dr Unit 25E
- 966 Worthington Woods Blvd
- 705 Keys View Ct Unit 67
- 7470 Sancus Blvd Unit 7470
- 908 Larkfield Dr
- 713 Michael View Ct Unit 86
- 994 Annagladys Dr Unit M4
- 7713 Kelvinway Dr Unit 67
- 7684 Whitneyway Dr Unit 18
- 7476 Liberton Place
- 889 Noddymill Ln E Unit 33C
- 579 Mawyer Dr Unit 168
- 0 Sancus Blvd
- 7679 Arapaho Ct
- 881 Upholland Ln Unit 20B
- 1137 Clement Dr
- 7884 Barkwood Dr Unit 20C
- 828 Pine Way Dr Unit C2
- 828 Pineway Dr
- 830 Pine Way Dr
- 826 Pine Way Dr Unit C1
- 832 Pine Way Dr
- 0 Pineway Dr
- 816 Pine Way Dr
- 816 Pine Way Dr Unit 2
- 820 Pineway Dr
- 818 Pine Way Dr Unit B3
- 818 Pine Way Dr Unit 3
- 814 Pineway Dr
- 841 Pine Way Dr Unit J4
- 800 Pineway Dr
- 820 Pine Way Dr Unit B4
- 814 Pine Way Dr Unit B1
- 842 Pineway Dr
- 818 Pineway Dr
- 818 Pineway Dr Unit B-3
- 851 Annagladys Dr
Your Personal Tour Guide
Ask me questions while you tour the home.