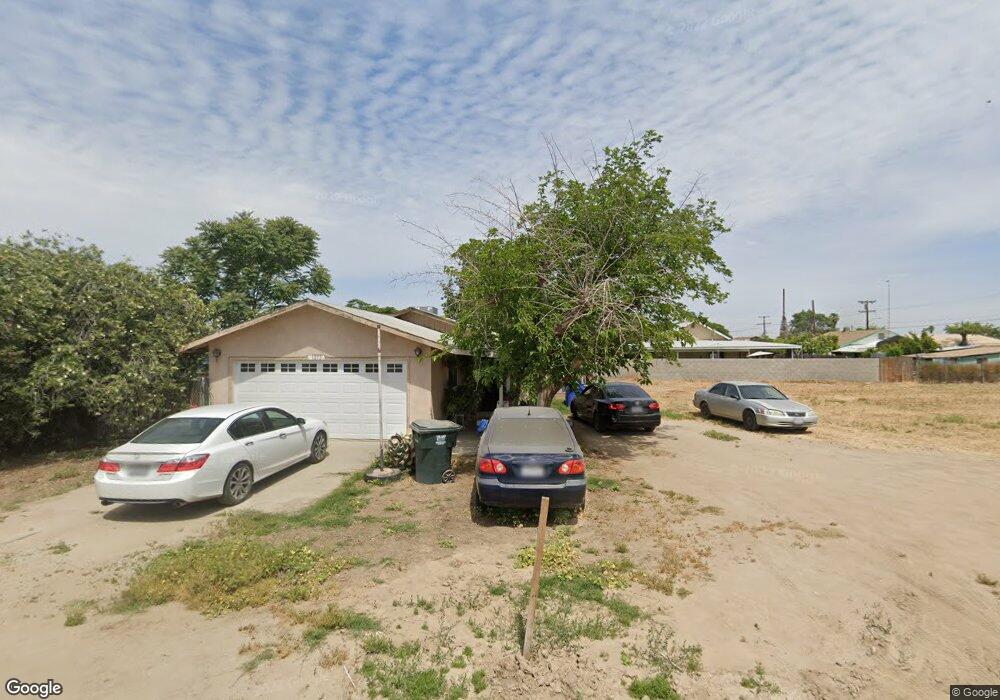
826 S Elm St Pixley, CA 93256
Estimated Value: $361,000 - $799,913
8
Beds
4
Baths
1,392
Sq Ft
$449/Sq Ft
Est. Value
About This Home
This home is located at 826 S Elm St, Pixley, CA 93256 and is currently estimated at $625,304, approximately $449 per square foot. 826 S Elm St is a home located in Tulare County with nearby schools including Pixley Elementary School, Palo Verde Elementary School, and Pixley Middle School.
Ownership History
Date
Name
Owned For
Owner Type
Purchase Details
Closed on
Nov 11, 2020
Sold by
Pixley Properties Lp
Bought by
Terrel Randal Lee
Current Estimated Value
Purchase Details
Closed on
May 11, 2017
Sold by
Terrel Clifford L
Bought by
Pixley Properties Lp
Purchase Details
Closed on
Jun 25, 2009
Sold by
Wolden Darrell
Bought by
Terrel Clifford L and Terrel Arvella E
Home Financials for this Owner
Home Financials are based on the most recent Mortgage that was taken out on this home.
Original Mortgage
$225,000
Interest Rate
4.83%
Mortgage Type
Seller Take Back
Purchase Details
Closed on
Jun 19, 2009
Sold by
Wolden Cheryl
Bought by
Wolden Darrell
Home Financials for this Owner
Home Financials are based on the most recent Mortgage that was taken out on this home.
Original Mortgage
$225,000
Interest Rate
4.83%
Mortgage Type
Seller Take Back
Purchase Details
Closed on
Jul 26, 1996
Sold by
Hereford Amy
Bought by
Wolden Shirley and Vital Rose
Create a Home Valuation Report for This Property
The Home Valuation Report is an in-depth analysis detailing your home's value as well as a comparison with similar homes in the area
Home Values in the Area
Average Home Value in this Area
Purchase History
| Date | Buyer | Sale Price | Title Company |
|---|---|---|---|
| Terrel Randal Lee | -- | None Available | |
| Pixley Properties Lp | -- | None Available | |
| Terrel Clifford L | $300,000 | Chicago Title Company | |
| Wolden Darrell | -- | Chicago Title Company | |
| Vital Rose | -- | Chicago Title Company | |
| Wolden Shirley | -- | -- |
Source: Public Records
Mortgage History
| Date | Status | Borrower | Loan Amount |
|---|---|---|---|
| Previous Owner | Terrel Clifford L | $225,000 |
Source: Public Records
Tax History Compared to Growth
Tax History
| Year | Tax Paid | Tax Assessment Tax Assessment Total Assessment is a certain percentage of the fair market value that is determined by local assessors to be the total taxable value of land and additions on the property. | Land | Improvement |
|---|---|---|---|---|
| 2025 | $3,897 | $351,788 | $108,242 | $243,546 |
| 2024 | $3,897 | $344,891 | $106,120 | $238,771 |
| 2023 | $3,798 | $338,130 | $104,040 | $234,090 |
| 2022 | $4,050 | $364,048 | $121,349 | $242,699 |
| 2021 | $4,015 | $356,910 | $118,970 | $237,940 |
| 2020 | $4,098 | $353,250 | $117,750 | $235,500 |
| 2019 | $4,231 | $346,323 | $115,441 | $230,882 |
| 2018 | $4,298 | $339,532 | $113,177 | $226,355 |
| 2017 | $4,255 | $332,875 | $110,958 | $221,917 |
| 2016 | $4,092 | $326,348 | $108,782 | $217,566 |
| 2015 | $3,844 | $321,446 | $107,148 | $214,298 |
| 2014 | $3,844 | $315,149 | $105,049 | $210,100 |
Source: Public Records
Map
Nearby Homes
- 1120 E Joanne Ave
- 980 E Joanne Ave
- 991 E Davis St
- 1541 Sarah Ave
- 565 E Joanne Ave
- 185 N Elm St
- 981 S Market St
- 281 N Pine St
- 542 E Howard Ave
- 1875 S Elm St
- 9999 N Elm St
- 99999 N Elm St
- 1430 N Park Dr
- 0 Road 120
- 3184 Road 122
- 2835 N School St
- 821 E Stanford Ave
- 10351 Avenue 112
- 2431 Road 128
- 7774 Road 132
- 1213 E Joanne Ave
- 725 Walnut St Unit B
- 725 Walnut St
- 0 Walnut St
- 756 S Elm St
- 707 Walnut St
- 1370 E Joanne Ave
- 859 Walnut St
- 702 Walnut St
- 1379 Walnut St
- 878 S Elm St Unit C
- 878 S Elm St
- 878 S Elm St
- 878 S Elm #B St
- 667 Walnut St
- 893 Walnut St
- 1402 E Joanne Ave
- 880 Walnut St
- 1403 E Joanne Ave
- 1399 Carla Ave