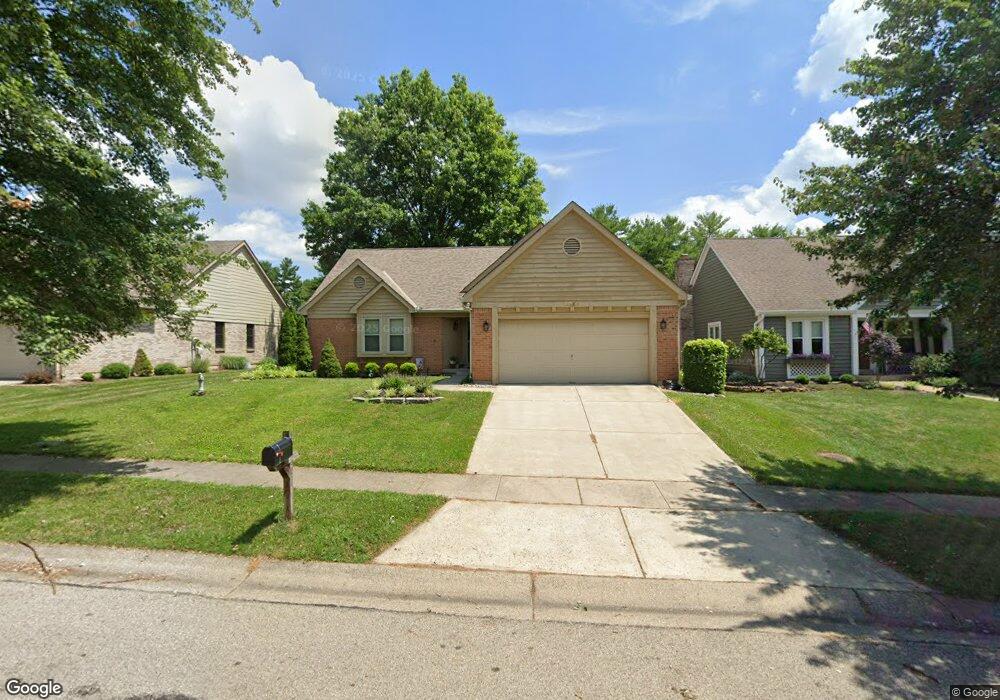
8260 Bayview Ln Maineville, OH 45039
Landen NeighborhoodEstimated Value: $355,161 - $491,000
3
Beds
2
Baths
1,429
Sq Ft
$282/Sq Ft
Est. Value
About This Home
This home is located at 8260 Bayview Ln, Maineville, OH 45039 and is currently estimated at $403,540, approximately $282 per square foot. 8260 Bayview Ln is a home located in Warren County with nearby schools including Kings Junior High School, Kings High School, and King Of Kings Lutheran Early Childhood Education.
Ownership History
Date
Name
Owned For
Owner Type
Purchase Details
Closed on
Nov 9, 2015
Sold by
Lasiewski Francis R
Bought by
Lasiewski Dorothy M and Lasiewski Lasiewski
Current Estimated Value
Home Financials for this Owner
Home Financials are based on the most recent Mortgage that was taken out on this home.
Interest Rate
3.87%
Purchase Details
Closed on
Jun 22, 2015
Sold by
Lasiewski Dorothy M and Lasiewski Francis R
Bought by
Lasiewski Dorothy M and Lasiewski Francis R
Purchase Details
Closed on
Mar 26, 2002
Sold by
Wallace Michael
Bought by
Lasiewski Frank and Lasiewski Dorothy
Purchase Details
Closed on
Sep 17, 1988
Sold by
Ramsey Ramsey and Ramsey Steven L
Bought by
Wallace Wallace and Wallace Michael
Purchase Details
Closed on
Jan 5, 1987
Sold by
Jack H Wieland Builders &
Bought by
Ramsey Ramsey and Ramsey Steven L
Purchase Details
Closed on
Mar 31, 1986
Sold by
Landen Farm Company
Bought by
Landen Farm Company
Create a Home Valuation Report for This Property
The Home Valuation Report is an in-depth analysis detailing your home's value as well as a comparison with similar homes in the area
Home Values in the Area
Average Home Value in this Area
Purchase History
| Date | Buyer | Sale Price | Title Company |
|---|---|---|---|
| Lasiewski Dorothy M | -- | -- | |
| Lasiewski Dorothy M | -- | None Available | |
| Lasiewski Frank | $177,500 | -- | |
| Wallace Wallace | $106,900 | -- | |
| Ramsey Ramsey | $97,300 | -- | |
| Landen Farm Company | -- | -- |
Source: Public Records
Mortgage History
| Date | Status | Borrower | Loan Amount |
|---|---|---|---|
| Closed | Lasiewski Dorothy M | -- |
Source: Public Records
Tax History
| Year | Tax Paid | Tax Assessment Tax Assessment Total Assessment is a certain percentage of the fair market value that is determined by local assessors to be the total taxable value of land and additions on the property. | Land | Improvement |
|---|---|---|---|---|
| 2025 | $5,123 | $108,000 | $24,500 | $83,500 |
| 2024 | $5,123 | $108,000 | $24,500 | $83,500 |
| 2023 | $4,246 | $81,809 | $13,842 | $67,966 |
| 2022 | $4,168 | $81,809 | $13,843 | $67,967 |
| 2021 | $3,492 | $81,809 | $13,843 | $67,967 |
| 2020 | $3,614 | $72,398 | $12,250 | $60,148 |
| 2019 | $3,658 | $72,398 | $12,250 | $60,148 |
| 2018 | $3,638 | $72,398 | $12,250 | $60,148 |
| 2017 | $3,756 | $66,906 | $11,508 | $55,398 |
| 2016 | $3,852 | $66,906 | $11,508 | $55,398 |
| 2015 | $3,421 | $65,986 | $11,508 | $54,478 |
| 2014 | $3,092 | $57,380 | $10,010 | $47,370 |
| 2013 | $3,097 | $70,230 | $12,250 | $57,980 |
Source: Public Records
Map
Nearby Homes
- 8050 Halyard Ct
- 8480 Island Pines Place
- 2675 Carriagegate Ln
- 7740 Hackney Cir
- 2798 Millstone Ct
- 7872 Hackney Cir
- 7846 Hackney Cir
- 8730 Exeter Place
- 2491 Old Mill Rd
- 3464 Simpson Trace
- 2898 Mossy Brink Ct Unit 19
- 7838 Carraway Ct
- 2280 Bridle Ct
- 8582 Southland Dr
- 8846 Morley Place
- 3301 Crescent Falls Way
- 3244 Grand Falls Blvd Unit 33I
- 3232 Grand Falls Blvd Unit 33F
- 8225 Winding Trail Place
- 8409 Winding Trail Place
- 8268 Bayview Ln
- 8248 Bayview Ln
- 8278 Bayview Ln
- 8259 Bayview Ln
- 8285 Bayview Ln
- 8249 Bayview Ln
- 8269 Bayview Ln
- 8279 Bayview Ln
- 8220 Mariner Ln
- 8294 Bayview Ln
- 8293 Bayview Ln
- 8221 Mariner Ln
- 2909 E Cove Ct
- 8300 Bayview Ln
- 2895 E Cove Ln
- 8301 Bayview Ln
- 8204 Mariner Ln
- 2948 Pine Grove Ln
- 8310 Bayview Ln
- 2875 E Cove Ln
Your Personal Tour Guide
Ask me questions while you tour the home.