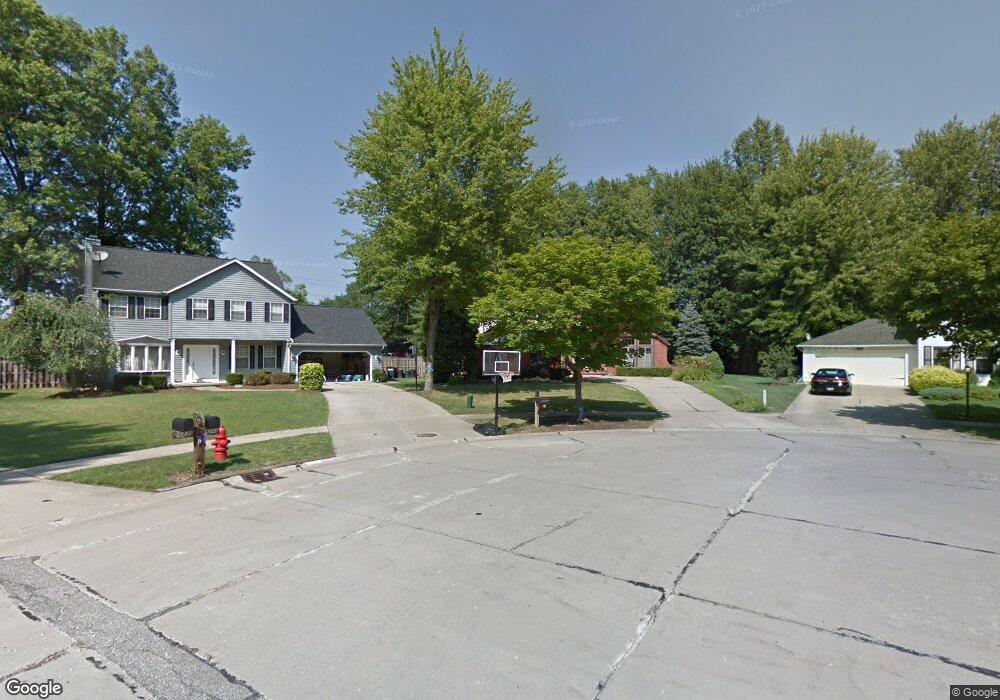
8261 Bradfords Gate Olmsted Falls, OH 44138
Estimated Value: $359,000 - $466,000
4
Beds
3
Baths
3,080
Sq Ft
$132/Sq Ft
Est. Value
About This Home
This home is located at 8261 Bradfords Gate, Olmsted Falls, OH 44138 and is currently estimated at $406,023, approximately $131 per square foot. 8261 Bradfords Gate is a home located in Cuyahoga County with nearby schools including Falls-Lenox Primary Elementary School, Olmsted Falls Intermediate Building, and Olmsted Falls Middle School.
Ownership History
Date
Name
Owned For
Owner Type
Purchase Details
Closed on
Aug 5, 2003
Sold by
Rogerson Beth and Walfridsson Peter
Bought by
Crosby Gregory L and Crosby Erin C
Current Estimated Value
Home Financials for this Owner
Home Financials are based on the most recent Mortgage that was taken out on this home.
Original Mortgage
$256,500
Interest Rate
5.31%
Mortgage Type
Balloon
Purchase Details
Closed on
Dec 28, 1999
Sold by
Neelis Joseph M and Neelis Beth S
Bought by
Neelis Beth S
Home Financials for this Owner
Home Financials are based on the most recent Mortgage that was taken out on this home.
Original Mortgage
$180,000
Interest Rate
7.69%
Purchase Details
Closed on
Sep 17, 1986
Bought by
Neelis Joseph M
Purchase Details
Closed on
Jan 1, 1986
Bought by
Shore West Const Co
Create a Home Valuation Report for This Property
The Home Valuation Report is an in-depth analysis detailing your home's value as well as a comparison with similar homes in the area
Home Values in the Area
Average Home Value in this Area
Purchase History
| Date | Buyer | Sale Price | Title Company |
|---|---|---|---|
| Crosby Gregory L | $270,000 | Signature Title | |
| Neelis Beth S | -- | Midland Title Security Inc | |
| Neelis Joseph M | $148,800 | -- | |
| Shore West Const Co | -- | -- |
Source: Public Records
Mortgage History
| Date | Status | Borrower | Loan Amount |
|---|---|---|---|
| Closed | Crosby Gregory L | $256,500 | |
| Closed | Neelis Beth S | $180,000 |
Source: Public Records
Tax History Compared to Growth
Tax History
| Year | Tax Paid | Tax Assessment Tax Assessment Total Assessment is a certain percentage of the fair market value that is determined by local assessors to be the total taxable value of land and additions on the property. | Land | Improvement |
|---|---|---|---|---|
| 2024 | $7,691 | $116,655 | $19,740 | $96,915 |
| 2023 | $8,553 | $107,040 | $19,920 | $87,120 |
| 2022 | $8,493 | $107,030 | $19,920 | $87,120 |
| 2021 | $8,414 | $107,030 | $19,920 | $87,120 |
| 2020 | $8,396 | $94,920 | $17,470 | $77,460 |
| 2019 | $7,476 | $271,200 | $49,900 | $221,300 |
| 2018 | $7,291 | $94,920 | $17,470 | $77,460 |
| 2017 | $7,733 | $93,210 | $14,700 | $78,510 |
| 2016 | $7,697 | $93,210 | $14,700 | $78,510 |
| 2015 | $7,501 | $93,210 | $14,700 | $78,510 |
| 2014 | $7,501 | $86,320 | $13,620 | $72,700 |
Source: Public Records
Map
Nearby Homes
- 26535 Bayfair Dr
- 29 Carl Ln
- 26788 Skyline Dr
- 26685 Cranage Rd
- 52 Periwinkle Dr
- V/L Columbia Rd
- 42 Periwinkle Dr
- 0
- 25725 Cook Rd
- 11 Concert Ct
- 26985 Glenside Ln
- V/L Usher Rd
- 7593 Columbia Rd
- 3 Concert Ln
- 7224 Pine Woods Way
- 3 Fiddle Sticks
- 7296 Chestnut Ct
- 27 Sycamore Dr
- Anderson Plan at Smokestack Trails
- Bramante Ranch Plan at Smokestack Trails
- 8245 Bradfords Gate
- 8287 Bradfords Gate
- 26537 Bagley Rd
- 8246 Bradfords Gate
- 26517 Bagley Rd
- 8332 Old Post Rd
- 8316 Old Post Rd
- 8262 Bradfords Gate
- 8278 Bradfords Gate
- 8294 Bradfords Gate
- 26597 Bagley Rd
- 8335 Bradfords Gate
- 8348 Old Post Rd
- 8310 Bradfords Gate
- 8291 Old Post Rd
- 8249 Brentwood Dr
- 8281 Brentwood Dr
- 8265 Brentwood Dr
- 8351 Bradfords Gate
- 8326 Bradfords Gate