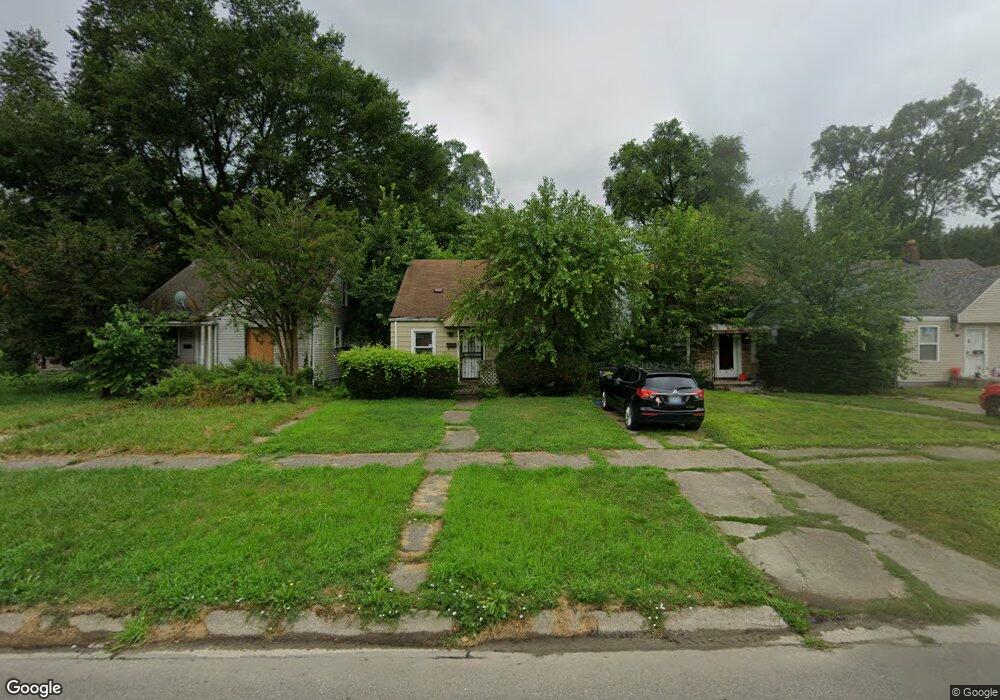
8261 Marlowe St Detroit, MI 48228
Fiskhorn NeighborhoodEstimated Value: $71,920 - $104,000
3
Beds
1
Bath
1,100
Sq Ft
$78/Sq Ft
Est. Value
About This Home
This home is located at 8261 Marlowe St, Detroit, MI 48228 and is currently estimated at $85,730, approximately $77 per square foot. 8261 Marlowe St is a home located in Wayne County with nearby schools including Barton Elementary School, Charles L. Spain Elementary-Middle School, and Edward 'Duke' Ellington Conservatory of Music and Art.
Ownership History
Date
Name
Owned For
Owner Type
Purchase Details
Closed on
Nov 16, 2021
Sold by
Kaid Inc
Bought by
Mokdetroit Llc
Current Estimated Value
Purchase Details
Closed on
Nov 16, 2017
Sold by
Sabree Eric R
Bought by
Kaid Mohamed and Kaid Inc
Purchase Details
Closed on
Sep 22, 2010
Sold by
Naamah Altahesh Khalil H and Naamah Almaidamah
Bought by
Cheibany Ahmedou O Ould
Purchase Details
Closed on
Feb 12, 2008
Sold by
Home Dealer Group Llc
Bought by
Altahesh Khalil Hamid
Purchase Details
Closed on
Dec 16, 2007
Sold by
Urban Development Solution Group Llc
Bought by
Home Dealer Group Llc
Purchase Details
Closed on
Nov 27, 2007
Sold by
Lasalle Bank Na
Bought by
Urban Development Solution Group Llc
Purchase Details
Closed on
Jul 12, 2006
Sold by
Lester Roland and Lester Cynthia
Bought by
Lasalle Bank Na and Afc Trust Series 2000-3
Create a Home Valuation Report for This Property
The Home Valuation Report is an in-depth analysis detailing your home's value as well as a comparison with similar homes in the area
Home Values in the Area
Average Home Value in this Area
Purchase History
| Date | Buyer | Sale Price | Title Company |
|---|---|---|---|
| Mokdetroit Llc | -- | None Available | |
| Mokdetroit Llc | -- | None Available | |
| Kaid Mohamed | $4,000 | None Available | |
| Cheibany Ahmedou O Ould | -- | Title One Inc | |
| Altahesh Khalil Hamid | -- | None Available | |
| Home Dealer Group Llc | -- | Lighthouse Title | |
| Urban Development Solution Group Llc | -- | Lighthouse Title | |
| Lasalle Bank Na | $65,155 | None Available |
Source: Public Records
Tax History Compared to Growth
Tax History
| Year | Tax Paid | Tax Assessment Tax Assessment Total Assessment is a certain percentage of the fair market value that is determined by local assessors to be the total taxable value of land and additions on the property. | Land | Improvement |
|---|---|---|---|---|
| 2025 | $908 | $29,600 | $0 | $0 |
| 2024 | $908 | $24,300 | $0 | $0 |
| 2023 | $880 | $20,000 | $0 | $0 |
| 2022 | $1,132 | $16,000 | $0 | $0 |
| 2021 | $909 | $13,500 | $0 | $0 |
| 2020 | $909 | $12,300 | $0 | $0 |
| 2019 | $897 | $9,400 | $0 | $0 |
| 2018 | $798 | $7,900 | $0 | $0 |
| 2017 | $135 | $7,100 | $0 | $0 |
| 2016 | $1,370 | $14,900 | $0 | $0 |
| 2015 | $1,490 | $14,900 | $0 | $0 |
| 2013 | $2,087 | $20,874 | $0 | $0 |
| 2010 | -- | $29,908 | $837 | $29,071 |
Source: Public Records
Map
Nearby Homes
- 8340 Marlowe St
- 8311 Marlowe St
- 8232 Marlowe St
- 8348 Terry St
- 8166 Lauder St
- 8289 Terry St
- 8585 Marlowe St
- 8134 Lauder St
- 8501 Terry St
- 8594 Lauder St
- 8129 Lauder St
- 8557 Mark Twain St
- 8066 Marlowe St
- 8260 Coyle St
- 8090 Robson St
- 8227 Coyle St
- 8282 Sussex St
- 8518 Sussex St
- 8160 Sussex St
- 8283 Sussex St
- 8269 Marlowe St
- 8255 Marlowe St
- 8249 Marlowe St
- 8275 Marlowe St
- 8283 Marlowe St
- 8241 Marlowe St
- 8268 Lauder St
- 8291 Marlowe St
- 8235 Marlowe St
- 8248 Lauder St
- 8284 Lauder St
- 8240 Lauder St
- 7654 Wisco Marlowe St
- 7654 Wisconsin St Marlowe St
- 8297 Marlowe St
- 8227 Marlowe St
- 8260 Marlowe St
- 8254 Marlowe St
- 8268 Marlowe St
- 8232 Lauder St