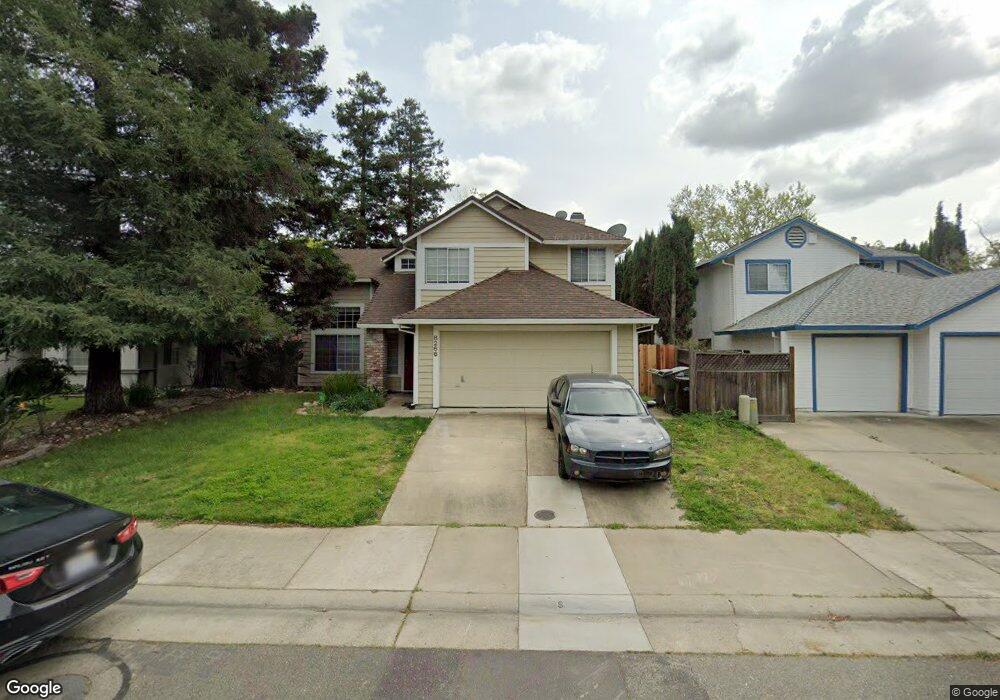
8266 Meadowhaven Dr Sacramento, CA 95828
Estimated Value: $348,000 - $589,000
3
Beds
2
Baths
1,672
Sq Ft
$296/Sq Ft
Est. Value
About This Home
This home is located at 8266 Meadowhaven Dr, Sacramento, CA 95828 and is currently estimated at $495,320, approximately $296 per square foot. 8266 Meadowhaven Dr is a home located in Sacramento County with nearby schools including Isabelle Jackson Elementary School, Edward Harris Jr. Middle School, and Monterey Trail High School.
Ownership History
Date
Name
Owned For
Owner Type
Purchase Details
Closed on
Mar 3, 2011
Sold by
Zorro Holdings Lp
Bought by
Jackson Andre L and Fuka Gladys A
Current Estimated Value
Home Financials for this Owner
Home Financials are based on the most recent Mortgage that was taken out on this home.
Original Mortgage
$161,791
Outstanding Balance
$114,810
Interest Rate
5.5%
Mortgage Type
FHA
Estimated Equity
$380,510
Purchase Details
Closed on
Oct 15, 2010
Sold by
Vang Paul S and Her Sheng
Bought by
Zorro Holdings Lp
Purchase Details
Closed on
Dec 15, 2006
Sold by
Johnson Carl M
Bought by
Vang Paul S and Her Sheng
Home Financials for this Owner
Home Financials are based on the most recent Mortgage that was taken out on this home.
Original Mortgage
$257,200
Interest Rate
6.12%
Mortgage Type
Purchase Money Mortgage
Create a Home Valuation Report for This Property
The Home Valuation Report is an in-depth analysis detailing your home's value as well as a comparison with similar homes in the area
Home Values in the Area
Average Home Value in this Area
Purchase History
| Date | Buyer | Sale Price | Title Company |
|---|---|---|---|
| Jackson Andre L | $166,000 | Old Republic Title Company | |
| Zorro Holdings Lp | $123,000 | None Available | |
| Vang Paul S | $321,500 | First American Title Co |
Source: Public Records
Mortgage History
| Date | Status | Borrower | Loan Amount |
|---|---|---|---|
| Open | Jackson Andre L | $161,791 | |
| Previous Owner | Vang Paul S | $257,200 |
Source: Public Records
Tax History Compared to Growth
Tax History
| Year | Tax Paid | Tax Assessment Tax Assessment Total Assessment is a certain percentage of the fair market value that is determined by local assessors to be the total taxable value of land and additions on the property. | Land | Improvement |
|---|---|---|---|---|
| 2025 | $2,394 | $212,660 | $44,833 | $167,827 |
| 2024 | $2,394 | $208,491 | $43,954 | $164,537 |
| 2023 | $2,336 | $204,404 | $43,093 | $161,311 |
| 2022 | $2,298 | $200,398 | $42,249 | $158,149 |
| 2021 | $2,273 | $196,470 | $41,421 | $155,049 |
| 2020 | $2,244 | $194,457 | $40,997 | $153,460 |
| 2019 | $2,205 | $190,645 | $40,194 | $150,451 |
| 2018 | $2,149 | $186,907 | $39,406 | $147,501 |
| 2017 | $2,113 | $183,243 | $38,634 | $144,609 |
| 2016 | $2,012 | $179,651 | $37,877 | $141,774 |
| 2015 | $3,273 | $176,954 | $37,309 | $139,645 |
| 2014 | $3,811 | $173,489 | $36,579 | $136,910 |
Source: Public Records
Map
Nearby Homes
- 8317 Honeycomb Way
- 8336 Cutler Way
- 8251 Apple Cove Ct
- 8186 Gustine Way
- 8012 Northern Oak Cir
- 8437 Yermo Way
- 8077 Goran Ct
- 7905 Springarden Way
- 8346 Floxtree Ct
- 8233 Short Rd
- 7901 Stevenson Ave
- 8095 E Stockton Blvd
- 8266 Summer Sunset Dr
- 8282 Union Creek Way
- 8336 Summer Sunset Dr
- 7715 Cotton Ln
- 4.13 ACR Lenhart Rd
- 8510 Cavendish Way
- 8216 Exbourne Cir
- 8476 W Stockton Blvd Unit 1
- 8270 Meadowhaven Dr
- 8262 Meadowhaven Dr
- 8265 Calla Way
- 8269 Calla Way
- 8258 Meadowhaven Dr
- 8274 Meadowhaven Dr
- 8261 Calla Way
- 8273 Calla Way
- 8257 Calla Way
- 8254 Meadowhaven Dr
- 8278 Meadowhaven Dr
- 8277 Calla Way
- 8253 Calla Way
- 8170 Sarasota Ct
- 8281 Calla Way
- 8172 Sarasota Ct
- 8250 Meadowhaven Dr
- 8282 Meadowhaven Dr
- 8264 Calla Way
- 8268 Calla Way