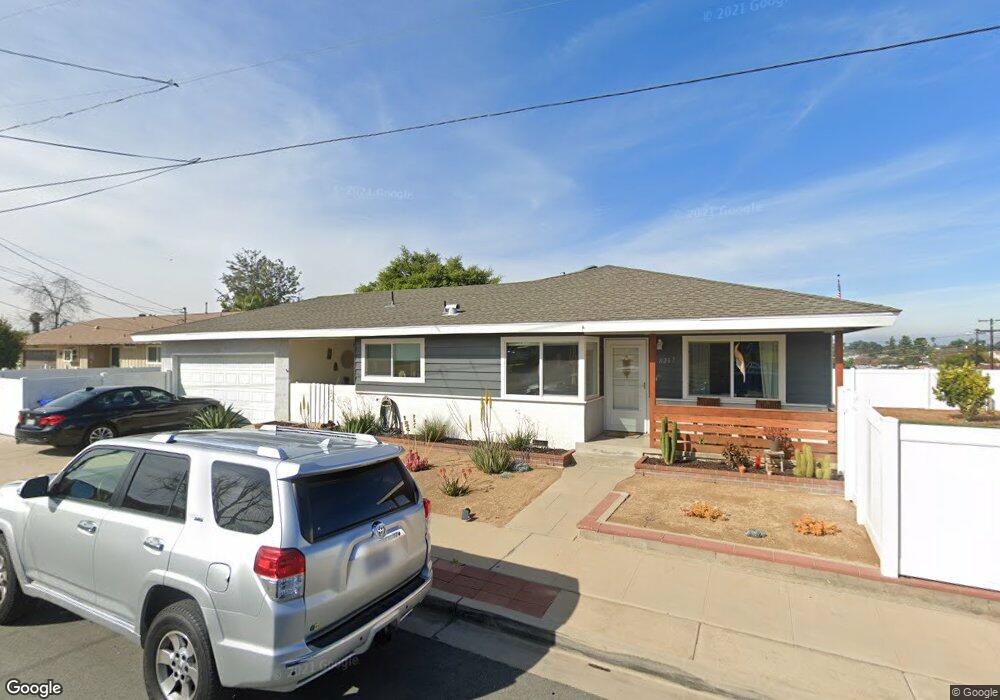
8267 Jefferson St Lemon Grove, CA 91945
Estimated Value: $703,891 - $766,000
3
Beds
1
Bath
1,185
Sq Ft
$624/Sq Ft
Est. Value
About This Home
This home is located at 8267 Jefferson St, Lemon Grove, CA 91945 and is currently estimated at $739,973, approximately $624 per square foot. 8267 Jefferson St is a home located in San Diego County with nearby schools including Mount Miguel High School, Saint John Of The Cross Catholic School, and Lighthouse Christian Academy.
Ownership History
Date
Name
Owned For
Owner Type
Purchase Details
Closed on
Feb 8, 2010
Sold by
Ledesma Raymond E and Ledesma Nevea R
Bought by
Lucas Andrew Dean and Benoit Sheri
Current Estimated Value
Home Financials for this Owner
Home Financials are based on the most recent Mortgage that was taken out on this home.
Original Mortgage
$309,900
Outstanding Balance
$204,999
Interest Rate
5.02%
Mortgage Type
VA
Estimated Equity
$534,974
Purchase Details
Closed on
Apr 22, 2009
Sold by
Ledesma Raymond E and Ledesma Nevea R
Bought by
Ledesma Ii Raymond E and Ledesma Nevea R
Purchase Details
Closed on
Apr 1, 2009
Sold by
Ledesma Raymond E and Ledesma Nevea R
Bought by
Ledesma Ii Raymond E and Ledesma Nevea R
Purchase Details
Closed on
Nov 30, 1988
Purchase Details
Closed on
Jul 16, 1985
Purchase Details
Closed on
May 15, 1985
Create a Home Valuation Report for This Property
The Home Valuation Report is an in-depth analysis detailing your home's value as well as a comparison with similar homes in the area
Home Values in the Area
Average Home Value in this Area
Purchase History
| Date | Buyer | Sale Price | Title Company |
|---|---|---|---|
| Lucas Andrew Dean | $300,000 | American Coast Title | |
| Ledesma Ii Raymond E | -- | None Available | |
| Ledesma Ii Raymond E | -- | None Available | |
| -- | $116,000 | -- | |
| -- | $87,900 | -- | |
| -- | $85,300 | -- |
Source: Public Records
Mortgage History
| Date | Status | Borrower | Loan Amount |
|---|---|---|---|
| Open | Lucas Andrew Dean | $309,900 |
Source: Public Records
Tax History Compared to Growth
Tax History
| Year | Tax Paid | Tax Assessment Tax Assessment Total Assessment is a certain percentage of the fair market value that is determined by local assessors to be the total taxable value of land and additions on the property. | Land | Improvement |
|---|---|---|---|---|
| 2025 | $5,167 | $387,230 | $158,593 | $228,637 |
| 2024 | $5,167 | $379,638 | $155,484 | $224,154 |
| 2023 | $5,037 | $372,195 | $152,436 | $219,759 |
| 2022 | $5,010 | $364,898 | $149,448 | $215,450 |
| 2021 | $4,943 | $357,744 | $146,518 | $211,226 |
| 2020 | $4,885 | $354,077 | $145,016 | $209,061 |
| 2019 | $4,807 | $347,135 | $142,173 | $204,962 |
| 2018 | $4,698 | $340,330 | $139,386 | $200,944 |
| 2017 | $150 | $333,657 | $136,653 | $197,004 |
| 2016 | $4,464 | $327,116 | $133,974 | $193,142 |
| 2015 | $4,436 | $322,203 | $131,962 | $190,241 |
| 2014 | $4,264 | $315,893 | $129,378 | $186,515 |
Source: Public Records
Map
Nearby Homes
- 8540 Vista Azul
- 8154 Golden Ave
- 8192 Golden Ave
- 8190 Golden Ave
- 8188 Golden Ave
- 8186 Golden Ave
- 8184 Golden Ave
- 8180 Golden Ave
- 8182 Golden Ave
- 8176 Golden Ave
- 8174 Golden Ave
- 8178 Golden Ave
- 8164 Golden Ave
- 8170 Golden Ave
- 8172 Golden Ave
- 8160 Golden Ave
- 8156 Golden Ave
- 8271 Golden Ave
- 2707 Sweetwater Rd
- 2515 Sweetwater Rd Unit SPC 23
- 8255 Jefferson St
- 2808 Dennis Ln
- 8243 Jefferson St
- 2829 Dennis Ln
- 2815 Dennis Ln
- 2855 Dennis Ln
- 2805 Dennis Ln
- 2796 Dennis Ln
- 8270 Jefferson St
- 8231 Jefferson St
- 8282 Jefferson St
- 8258 Jefferson St
- 8246 Jefferson St
- 8290 Jefferson St
- 2795 Dennis Ln
- 8236 Jefferson St
- 2805 Golden Grove Place
- 8296 Jefferson St
- 2770 Dennis Ln
- 2783 Washington St