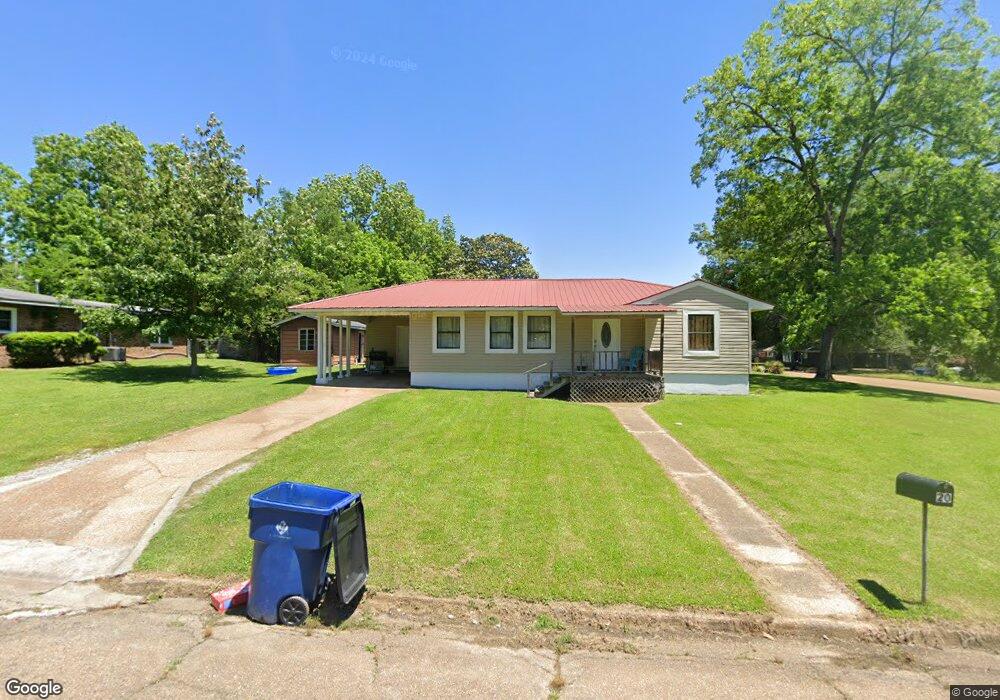
827 Douglas St West Point, MS 39773
Estimated Value: $95,000 - $129,000
3
Beds
--
Bath
1,458
Sq Ft
$80/Sq Ft
Est. Value
About This Home
This home is located at 827 Douglas St, West Point, MS 39773 and is currently estimated at $116,708, approximately $80 per square foot. 827 Douglas St is a home located in Clay County with nearby schools including East Side Elementary School, West Clay Elementary School, and Church Hill Elementary School.
Ownership History
Date
Name
Owned For
Owner Type
Purchase Details
Closed on
Jul 20, 2022
Sold by
Joe Williams Timothy
Bought by
Britt Christopher Wayne and Britt Tnya Lynn
Current Estimated Value
Home Financials for this Owner
Home Financials are based on the most recent Mortgage that was taken out on this home.
Original Mortgage
$83,460
Outstanding Balance
$79,042
Interest Rate
5.23%
Mortgage Type
FHA
Estimated Equity
$37,666
Purchase Details
Closed on
Apr 30, 2019
Sold by
Jackson John H and Jackson Toni M
Bought by
Duncan William Todd
Purchase Details
Closed on
Oct 14, 2008
Sold by
Casey Nation Dorothy Jack and Casey Deborah J
Bought by
Williams Timothy Joe and Williams Kathryn
Home Financials for this Owner
Home Financials are based on the most recent Mortgage that was taken out on this home.
Original Mortgage
$48,854
Interest Rate
6.36%
Create a Home Valuation Report for This Property
The Home Valuation Report is an in-depth analysis detailing your home's value as well as a comparison with similar homes in the area
Purchase History
| Date | Buyer | Sale Price | Title Company |
|---|---|---|---|
| Britt Christopher Wayne | -- | None Listed On Document | |
| Duncan William Todd | -- | -- | |
| Williams Timothy Joe | -- | -- |
Source: Public Records
Mortgage History
| Date | Status | Borrower | Loan Amount |
|---|---|---|---|
| Open | Britt Christopher Wayne | $83,460 | |
| Previous Owner | Williams Timothy Joe | $48,854 |
Source: Public Records
Tax History
| Year | Tax Paid | Tax Assessment Tax Assessment Total Assessment is a certain percentage of the fair market value that is determined by local assessors to be the total taxable value of land and additions on the property. | Land | Improvement |
|---|---|---|---|---|
| 2025 | $619 | $11,423 | $2,198 | $9,225 |
| 2024 | $619 | $11,423 | $2,198 | $9,225 |
| 2023 | $911 | $6,085 | $1,466 | $4,619 |
| 2022 | $211 | $6,085 | $1,466 | $4,619 |
| 2021 | $210 | $6,085 | $1,466 | $4,619 |
| 2020 | $212 | $6,085 | $1,466 | $4,619 |
| 2019 | $185 | $5,942 | $1,466 | $4,476 |
| 2018 | $173 | $5,942 | $1,466 | $4,476 |
| 2017 | $173 | $5,942 | $1,466 | $4,476 |
| 2016 | $167 | $5,942 | $1,466 | $4,476 |
| 2015 | $159 | $5,355 | $1,466 | $3,889 |
| 2014 | $243 | $5,355 | $1,466 | $3,889 |
| 2013 | $243 | $5,355 | $1,466 | $3,889 |
Source: Public Records
Map
Nearby Homes
- 15 David St
- 229 Clark Cir
- 1414 E Brame Ave
- 1046 E Brame Ave
- 112 Meadow Hill Rd
- 405 S Eshman Ave
- 44 Torbert Dr
- 472 S Eshman Ave
- 507 S Eshman Ave
- 228 Mccord St
- 65 Calhoun St
- 98 Calhoun St
- 389 Mapleview Rd
- 329 Converse Dr
- 278 Converse Dr
- 341 Mccord St
- 105 Converse Dr
- 600 E Westbrook St
- 238 Calhoun St
- 264 Mapleview Rd
Your Personal Tour Guide
Ask me questions while you tour the home.