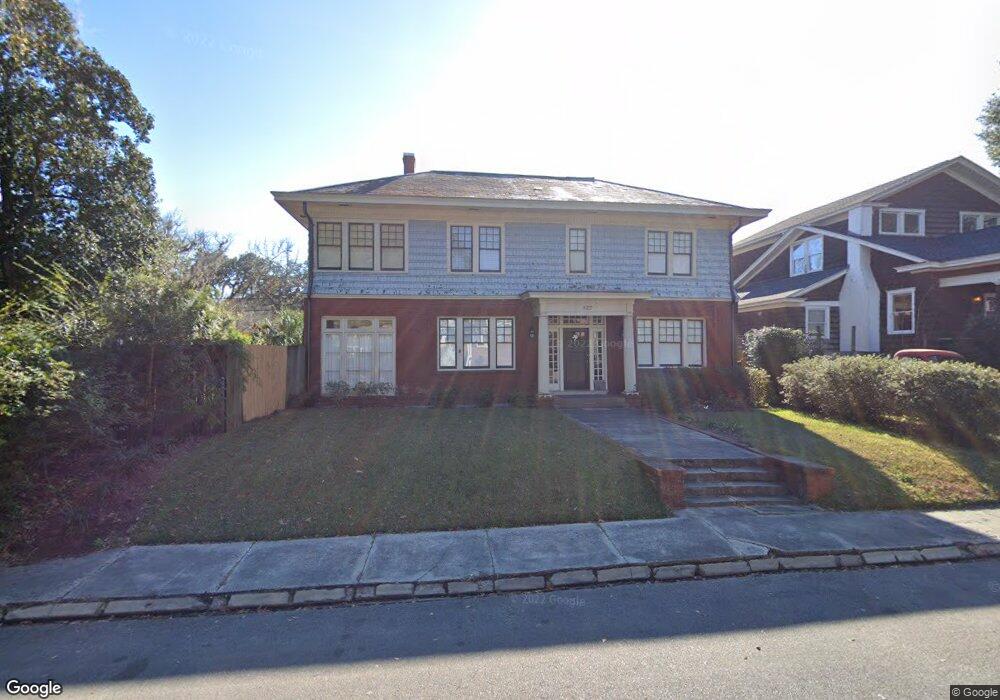
827 E 41st St Savannah, GA 31401
Ardsley Park-Chatham Crescent NeighborhoodEstimated Value: $640,000 - $754,000
3
Beds
3
Baths
2,351
Sq Ft
$298/Sq Ft
Est. Value
About This Home
This home is located at 827 E 41st St, Savannah, GA 31401 and is currently estimated at $699,458, approximately $297 per square foot. 827 E 41st St is a home located in Chatham County with nearby schools including Shuman Elementary School, Hubert Middle School, and Savannah Arts Academy.
Ownership History
Date
Name
Owned For
Owner Type
Purchase Details
Closed on
Dec 3, 2010
Sold by
Mckellar Robert R
Bought by
Jackson Marilyn J
Current Estimated Value
Home Financials for this Owner
Home Financials are based on the most recent Mortgage that was taken out on this home.
Original Mortgage
$246,370
Outstanding Balance
$163,598
Interest Rate
4.32%
Mortgage Type
Commercial
Estimated Equity
$535,860
Create a Home Valuation Report for This Property
The Home Valuation Report is an in-depth analysis detailing your home's value as well as a comparison with similar homes in the area
Home Values in the Area
Average Home Value in this Area
Purchase History
| Date | Buyer | Sale Price | Title Company |
|---|---|---|---|
| Jackson Marilyn J | -- | -- |
Source: Public Records
Mortgage History
| Date | Status | Borrower | Loan Amount |
|---|---|---|---|
| Open | Jackson Marilyn J | $246,370 |
Source: Public Records
Tax History
| Year | Tax Paid | Tax Assessment Tax Assessment Total Assessment is a certain percentage of the fair market value that is determined by local assessors to be the total taxable value of land and additions on the property. | Land | Improvement |
|---|---|---|---|---|
| 2025 | $1,691 | $261,960 | $58,240 | $203,720 |
| 2024 | $11 | $221,360 | $58,240 | $163,120 |
| 2023 | $687 | $240,600 | $58,240 | $182,360 |
| 2022 | $1,530 | $201,120 | $39,200 | $161,920 |
| 2021 | $2,345 | $181,480 | $40,000 | $141,480 |
| 2020 | $1,534 | $177,320 | $40,000 | $137,320 |
| 2019 | $2,342 | $177,320 | $40,000 | $137,320 |
| 2018 | $1,511 | $164,160 | $40,000 | $124,160 |
| 2017 | $1,356 | $168,520 | $43,160 | $125,360 |
| 2016 | $1,331 | $155,440 | $43,160 | $112,280 |
| 2015 | $2,065 | $148,360 | $43,160 | $105,200 |
| 2014 | $2,665 | $150,280 | $0 | $0 |
Source: Public Records
Map
Nearby Homes