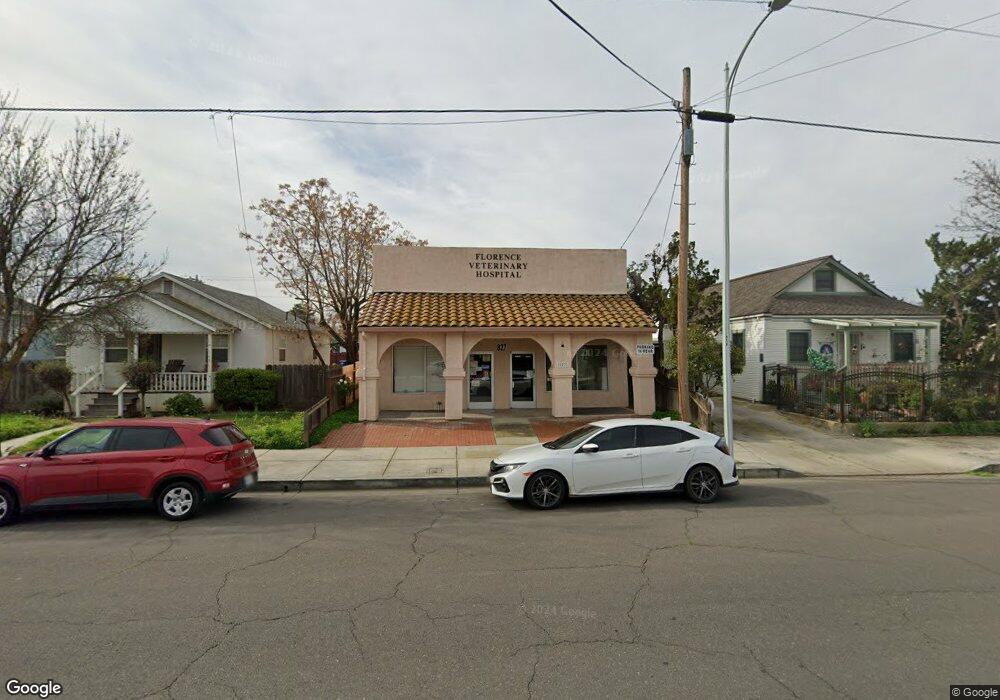
827 I St Los Banos, CA 93635
Estimated Value: $262,477
--
Bed
2
Baths
1,240
Sq Ft
$212/Sq Ft
Est. Value
About This Home
This home is located at 827 I St, Los Banos, CA 93635 and is currently estimated at $262,477, approximately $211 per square foot. 827 I St is a home located in Merced County with nearby schools including Los Banos Elementary School, Creekside Junior High School, and Los Banos High School.
Ownership History
Date
Name
Owned For
Owner Type
Purchase Details
Closed on
Jan 13, 2017
Sold by
Han And Sau Chao Llc
Bought by
Gutierrez Jorge Jaime Flores and Flores Ana Ligia
Current Estimated Value
Purchase Details
Closed on
Dec 19, 2012
Sold by
The Han & Sau Chao Lau Trust
Bought by
Han & Sau Chao Llc
Purchase Details
Closed on
Jul 21, 2010
Sold by
Castaneda Joel and Castaneda Bobbie
Bought by
Lau Han and Lau Sau Chao
Purchase Details
Closed on
Apr 5, 2000
Sold by
Castaneda and Bobbie
Bought by
Castaneda Joel and Castaneda Bobbie
Purchase Details
Closed on
Sep 2, 1997
Sold by
Lee Arreca Mary
Bought by
Castaneda Joel and Castaneda Bobbie
Create a Home Valuation Report for This Property
The Home Valuation Report is an in-depth analysis detailing your home's value as well as a comparison with similar homes in the area
Home Values in the Area
Average Home Value in this Area
Purchase History
| Date | Buyer | Sale Price | Title Company |
|---|---|---|---|
| Gutierrez Jorge Jaime Flores | $142,500 | Transcounty Title Company | |
| Han & Sau Chao Llc | -- | None Available | |
| Lau Han | $105,000 | Transcounty Title Company | |
| Castaneda Joel | -- | -- | |
| Castaneda Joel | $10,000 | Chicago Title Co |
Source: Public Records
Tax History Compared to Growth
Tax History
| Year | Tax Paid | Tax Assessment Tax Assessment Total Assessment is a certain percentage of the fair market value that is determined by local assessors to be the total taxable value of land and additions on the property. | Land | Improvement |
|---|---|---|---|---|
| 2025 | $1,835 | $165,378 | $87,041 | $78,337 |
| 2024 | $1,835 | $162,136 | $85,335 | $76,801 |
| 2023 | $1,733 | $158,958 | $83,662 | $75,296 |
| 2022 | $1,708 | $155,842 | $82,022 | $73,820 |
| 2021 | $1,692 | $152,787 | $80,414 | $72,373 |
| 2020 | $1,673 | $151,221 | $79,590 | $71,631 |
| 2019 | $1,643 | $148,257 | $78,030 | $70,227 |
| 2018 | $1,594 | $145,350 | $76,500 | $68,850 |
| 2017 | $1,283 | $115,907 | $60,713 | $55,194 |
| 2016 | $1,298 | $113,635 | $59,523 | $54,112 |
| 2015 | $1,271 | $111,929 | $58,629 | $53,300 |
| 2014 | $1,237 | $109,737 | $57,481 | $52,256 |
Source: Public Records
Map
Nearby Homes