827 Milledge Rd Augusta, GA 30904
Summerville NeighborhoodEstimated Value: $203,000 - $253,000
2
Beds
2
Baths
1,262
Sq Ft
$177/Sq Ft
Est. Value
About This Home
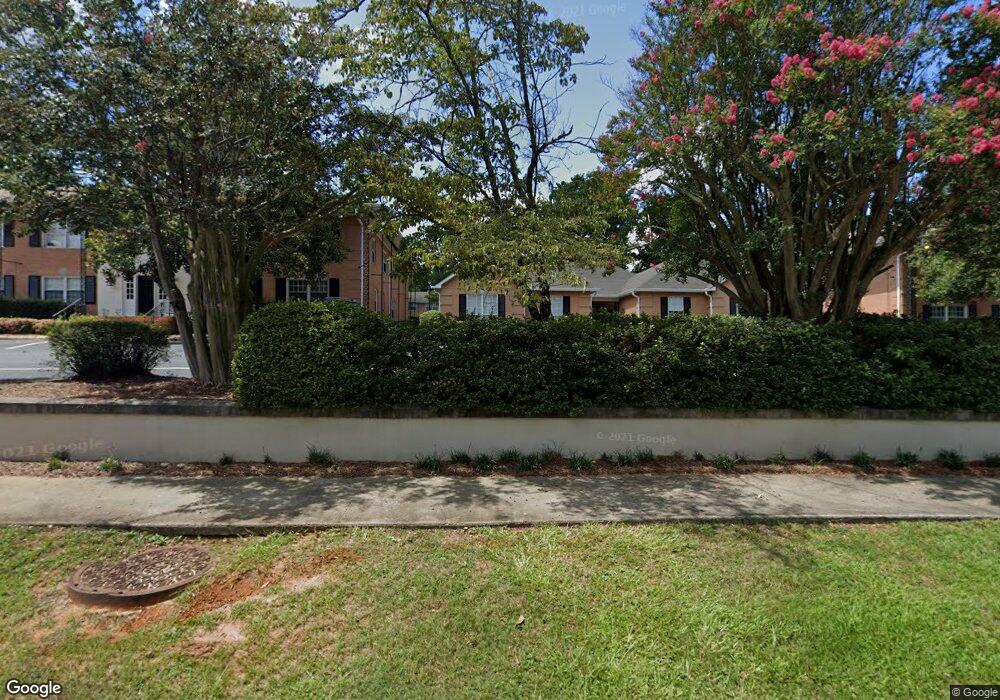
This home is located at 827 Milledge Rd, Augusta, GA 30904 and is currently estimated at $223,586, approximately $177 per square foot. 827 Milledge Rd is a home located in Richmond County with nearby schools including R.B. Hunt Elementary School, Lake Forest Hills Elementary School, and Langford Middle School.
Ownership History
Date
Name
Owned For
Owner Type
Purchase Details
Closed on
Jan 23, 2025
Sold by
Blanchard Gwen B
Bought by
Sasnett Richard Borden
Current Estimated Value
Purchase Details
Closed on
Jun 26, 2020
Sold by
Blanchard Patrick
Bought by
Blanchard Gwen B
Purchase Details
Closed on
Jun 11, 2018
Sold by
Rider Robert A
Bought by
Blanchard Patrick and Blanchard Gwen B
Purchase Details
Closed on
Aug 13, 2004
Sold by
Steinberg Stephen H and Agress Joyce Lipsitz
Bought by
Rider Robert W and Rider Melinda S
Purchase Details
Closed on
Mar 15, 1993
Sold by
Law William F
Bought by
Agress Joyce L
Purchase Details
Closed on
Dec 18, 1987
Sold by
Bible Jim C Iii Connolly D Hugh Franke W
Bought by
Law William F
Create a Home Valuation Report for This Property
The Home Valuation Report is an in-depth analysis detailing your home's value as well as a comparison with similar homes in the area
Home Values in the Area
Average Home Value in this Area
Purchase History
| Date | Buyer | Sale Price | Title Company |
|---|---|---|---|
| Sasnett Richard Borden | $225,000 | -- | |
| Blanchard Gwen B | -- | -- | |
| Blanchard Patrick | $131,000 | -- | |
| Rider Robert W | $78,000 | -- | |
| Agress Joyce L | $65,000 | -- | |
| Law William F | $77,500 | -- |
Source: Public Records
Tax History Compared to Growth
Tax History
| Year | Tax Paid | Tax Assessment Tax Assessment Total Assessment is a certain percentage of the fair market value that is determined by local assessors to be the total taxable value of land and additions on the property. | Land | Improvement |
|---|---|---|---|---|
| 2025 | $798 | $82,388 | $12,000 | $70,388 |
| 2024 | $798 | $77,524 | $12,000 | $65,524 |
| 2023 | $473 | $66,636 | $12,000 | $54,636 |
| 2022 | $549 | $47,449 | $12,000 | $35,449 |
| 2021 | $619 | $47,816 | $12,000 | $35,816 |
| 2020 | $415 | $33,412 | $6,200 | $27,212 |
| 2019 | $444 | $33,412 | $6,200 | $27,212 |
| 2018 | $1,194 | $33,412 | $6,200 | $27,212 |
| 2017 | $1,187 | $33,412 | $6,200 | $27,212 |
| 2016 | $1,188 | $33,412 | $6,200 | $27,212 |
| 2015 | $1,196 | $33,412 | $6,200 | $27,212 |
| 2014 | $1,508 | $33,412 | $6,200 | $27,212 |
Source: Public Records
Map
Nearby Homes
- 2213 Clayton Ln
- 2211 Clayton Ln
- 2207 Clayton Ln
- 2203 Clayton Ln
- 2201 Clayton Ln
- 2110 Carnes Place
- 946 Milledge Rd
- 2204 Gardner St
- 732 Katherine St
- 2232 Mcdowell St
- 705 Hickman Rd
- 1010 Hickman Rd Unit B5
- 1010 Hickman Rd Unit B3
- 1010 Hickman Rd Unit A2
- 844 Heard Ave
- 729 Heard Ave
- 930 Heard Ave
- 2220 Kings Way
- 827 Milledge Rd Unit B2
- 827 Milledge Rd Unit 1
- 827 Milledge Rd Unit F9
- 827 Milledge Rd Unit F8
- 827 Milledge Rd
- 827 Milledge Rd
- 827 Milledge Rd Unit F1
- 827 Milledge Rd
- 827 Milledge Rd
- 827 Milledge Rd Unit F6
- 827 Milledge Rd
- 827 Milledge Rd
- 827 Milledge Rd Unit E2
- 827 Milledge Rd Unit E1
- 827 Milledge Rd Unit D4
- 827 Milledge Rd Unit D3
- 827 Milledge Rd
- 827 Milledge Rd
- 827 Milledge Rd Unit C4
- 827 Milledge Rd