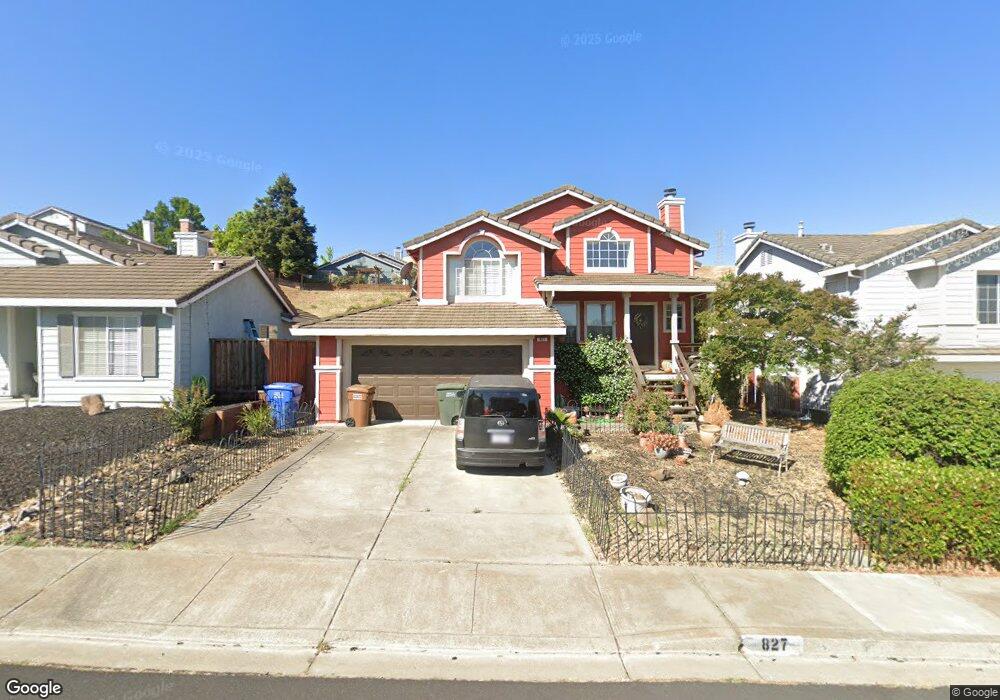
827 Steffa St Bay Point, CA 94565
Estimated Value: $505,000 - $708,000
4
Beds
3
Baths
1,672
Sq Ft
$370/Sq Ft
Est. Value
About This Home
This home is located at 827 Steffa St, Bay Point, CA 94565 and is currently estimated at $619,428, approximately $370 per square foot. 827 Steffa St is a home located in Contra Costa County with nearby schools including Shore Acres Elementary School, Riverview Middle School, and Mt. Diablo High School.
Ownership History
Date
Name
Owned For
Owner Type
Purchase Details
Closed on
Jul 13, 2005
Sold by
Petersen Amelia and Petersen Amelia A
Bought by
Petersen Paul and Petersen Amelia
Current Estimated Value
Home Financials for this Owner
Home Financials are based on the most recent Mortgage that was taken out on this home.
Original Mortgage
$336,000
Outstanding Balance
$173,693
Interest Rate
5.51%
Mortgage Type
Stand Alone Refi Refinance Of Original Loan
Estimated Equity
$445,735
Purchase Details
Closed on
Aug 20, 2002
Sold by
Petersen Paul D
Bought by
Petersen Amelia and Petersen Amelia A
Home Financials for this Owner
Home Financials are based on the most recent Mortgage that was taken out on this home.
Original Mortgage
$208,000
Interest Rate
6.43%
Mortgage Type
Purchase Money Mortgage
Purchase Details
Closed on
Nov 23, 1995
Sold by
Kaufman & Broad Of Northern Ca Inc
Bought by
Petersen Paul D and Petersen Amelia A
Home Financials for this Owner
Home Financials are based on the most recent Mortgage that was taken out on this home.
Original Mortgage
$181,968
Interest Rate
7.42%
Mortgage Type
Seller Take Back
Create a Home Valuation Report for This Property
The Home Valuation Report is an in-depth analysis detailing your home's value as well as a comparison with similar homes in the area
Home Values in the Area
Average Home Value in this Area
Purchase History
| Date | Buyer | Sale Price | Title Company |
|---|---|---|---|
| Petersen Paul | -- | Alliance Title Company | |
| Petersen Amelia | -- | Old Republic Title Company | |
| Petersen Paul D | $178,500 | First American Title Guarant |
Source: Public Records
Mortgage History
| Date | Status | Borrower | Loan Amount |
|---|---|---|---|
| Open | Petersen Paul | $336,000 | |
| Closed | Petersen Amelia | $208,000 | |
| Closed | Petersen Paul D | $181,968 |
Source: Public Records
Tax History
| Year | Tax Paid | Tax Assessment Tax Assessment Total Assessment is a certain percentage of the fair market value that is determined by local assessors to be the total taxable value of land and additions on the property. | Land | Improvement |
|---|---|---|---|---|
| 2025 | $4,851 | $296,338 | $83,045 | $213,293 |
| 2024 | $4,715 | $290,528 | $81,417 | $209,111 |
| 2023 | $4,617 | $284,832 | $79,821 | $205,011 |
| 2022 | $4,572 | $279,248 | $78,256 | $200,992 |
| 2021 | $4,459 | $273,773 | $76,722 | $197,051 |
| 2019 | $4,341 | $265,655 | $74,448 | $191,207 |
| 2018 | $4,201 | $260,447 | $72,989 | $187,458 |
| 2017 | $4,077 | $255,341 | $71,558 | $183,783 |
| 2016 | $3,965 | $250,335 | $70,155 | $180,180 |
| 2015 | $3,921 | $246,576 | $69,102 | $177,474 |
| 2014 | $3,859 | $241,747 | $67,749 | $173,998 |
Source: Public Records
Map
Nearby Homes
Your Personal Tour Guide
Ask me questions while you tour the home.