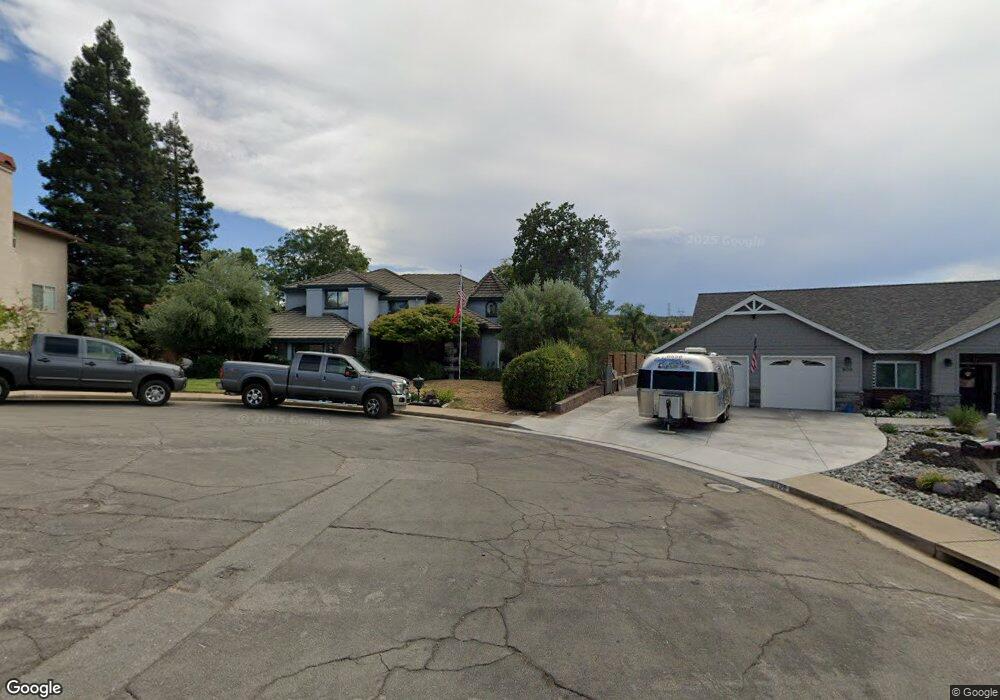
827 Sunkist Ct Redding, CA 96001
Sunset NeighborhoodEstimated Value: $730,000 - $781,951
5
Beds
3
Baths
4,014
Sq Ft
$187/Sq Ft
Est. Value
About This Home
This home is located at 827 Sunkist Ct, Redding, CA 96001 and is currently estimated at $751,738, approximately $187 per square foot. 827 Sunkist Ct is a home located in Shasta County with nearby schools including Manzanita Elementary School, Sequoia Middle School, and Shasta High School.
Ownership History
Date
Name
Owned For
Owner Type
Purchase Details
Closed on
Apr 19, 2021
Sold by
Areliano Richard T and Arellano Pauline
Bought by
Arellano Pauline and Areliano Richard T
Current Estimated Value
Purchase Details
Closed on
Mar 14, 2012
Sold by
Arellano Richard T and Arellano Pauline E
Bought by
Arellano Richard T and Arellano Pauline
Home Financials for this Owner
Home Financials are based on the most recent Mortgage that was taken out on this home.
Original Mortgage
$400,000
Interest Rate
3.83%
Mortgage Type
New Conventional
Purchase Details
Closed on
Jun 15, 2004
Sold by
Arellano Richard T and Arellano Pauline E
Bought by
Arellano Ted and Arellano Pauline
Create a Home Valuation Report for This Property
The Home Valuation Report is an in-depth analysis detailing your home's value as well as a comparison with similar homes in the area
Home Values in the Area
Average Home Value in this Area
Purchase History
| Date | Buyer | Sale Price | Title Company |
|---|---|---|---|
| Arellano Pauline | -- | Old Republic Title Company | |
| Arellano Richard T | -- | Old Republic Title Company | |
| Arellano Richard T | -- | Fidelity National Title Co | |
| Arellano Richard T | -- | Fidelity National Title Co | |
| Arellano Ted | -- | -- |
Source: Public Records
Mortgage History
| Date | Status | Borrower | Loan Amount |
|---|---|---|---|
| Closed | Arellano Richard T | $400,000 |
Source: Public Records
Tax History
| Year | Tax Paid | Tax Assessment Tax Assessment Total Assessment is a certain percentage of the fair market value that is determined by local assessors to be the total taxable value of land and additions on the property. | Land | Improvement |
|---|---|---|---|---|
| 2025 | $5,758 | $566,306 | $80,627 | $485,679 |
| 2024 | $5,670 | $555,203 | $79,047 | $476,156 |
| 2023 | $5,670 | $544,318 | $77,498 | $466,820 |
| 2022 | $5,573 | $533,646 | $75,979 | $457,667 |
| 2021 | $5,547 | $523,184 | $74,490 | $448,694 |
| 2020 | $5,621 | $517,821 | $73,727 | $444,094 |
| 2019 | $5,295 | $504,043 | $72,282 | $431,761 |
| 2018 | $5,381 | $497,715 | $70,865 | $426,850 |
| 2017 | $5,352 | $487,957 | $69,476 | $418,481 |
| 2016 | $5,180 | $478,390 | $68,114 | $410,276 |
| 2015 | $5,113 | $471,205 | $67,091 | $404,114 |
| 2014 | $5,078 | $461,975 | $65,777 | $396,198 |
Source: Public Records
Map
Nearby Homes
- 920 Hallmark Dr
- 910 Hallmark Dr
- 938 Leisha Ln
- 4124 Acadia Place
- 968 Katmai Place
- 3510 Eureka Way
- 1430 Ridge Dr
- 3330 Scenic Dr
- 3410 Scenic Dr
- 3582 Stone Ridge Place
- 866 Palatine Ct
- 4601 Lower Springs Rd
- 4657 Lower Springs Rd
- 4677 Lower Springs Rd
- 805 Congaree Ln
- 582 River Oaks Dr
- 4691 Lower Springs Rd
- 791 Congaree Ln
- 1426 Gladstone Ct
- 4648 Kilkee Dr
- 809 Sunkist Ct
- 853 Sunkist Ct
- 8553 Sunkist Ct
- 881 Sunkist Ct
- 820 Sunkist Ct
- 844 Sunkist Ct
- 876 Sunkist Ct
- 3728 Sunflower Dr
- 3778 Ferrero Way
- 63 Sunflower Dr
- 3737 Sunflower Dr
- 3792 Ferrero Way
- 3764 Ferrero Way
- 3763 Sunlight Ct
- 3875 Mario Ave
- 3725 Sunflower Dr
- 3750 Ferrero Way Unit Lot 36 Sunset Aven
- 3750 Ferrero Way
- 3745 Sunlight Ct Unit 1
- 3745 Sunlight Ct
Your Personal Tour Guide
Ask me questions while you tour the home.