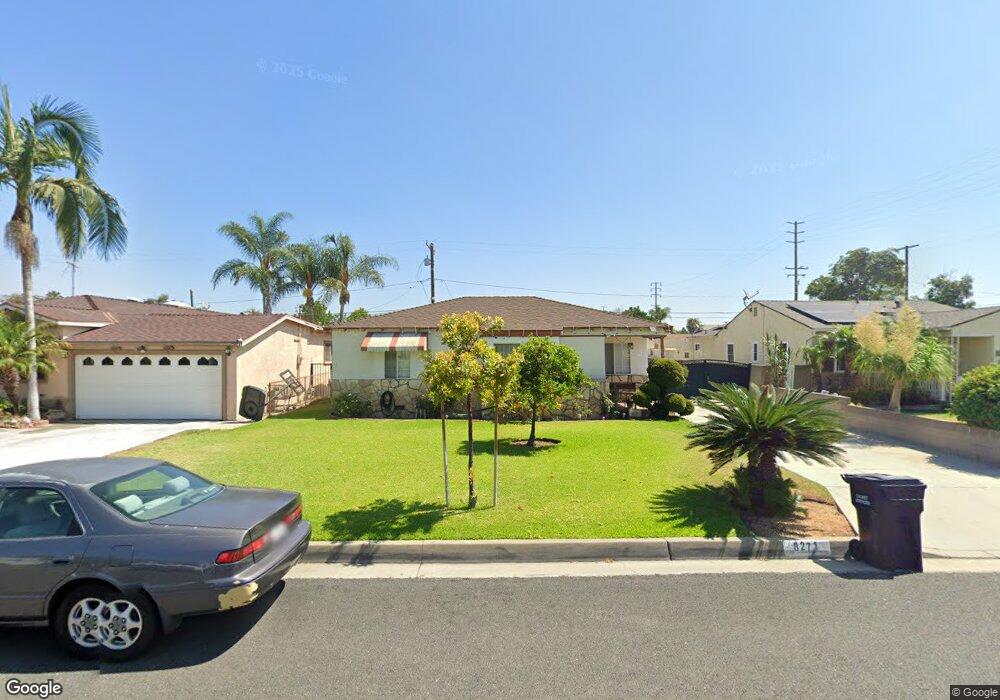
8271 Quoit St Downey, CA 90242
Estimated Value: $834,000 - $910,000
2
Beds
2
Baths
1,577
Sq Ft
$545/Sq Ft
Est. Value
About This Home
This home is located at 8271 Quoit St, Downey, CA 90242 and is currently estimated at $859,801, approximately $545 per square foot. 8271 Quoit St is a home located in Los Angeles County with nearby schools including Imperial Elementary School, Old River Elementary School, and West Middle School.
Ownership History
Date
Name
Owned For
Owner Type
Purchase Details
Closed on
May 15, 2015
Sold by
Sosa Noe A
Bought by
Sosa Noe A and Sosa Leticia
Current Estimated Value
Home Financials for this Owner
Home Financials are based on the most recent Mortgage that was taken out on this home.
Original Mortgage
$255,000
Outstanding Balance
$196,157
Interest Rate
3.64%
Mortgage Type
New Conventional
Estimated Equity
$663,644
Purchase Details
Closed on
Mar 12, 2002
Sold by
Mulvoy Terence J
Bought by
Sosa Noe and Sosa Leticia
Home Financials for this Owner
Home Financials are based on the most recent Mortgage that was taken out on this home.
Original Mortgage
$192,000
Interest Rate
6.87%
Purchase Details
Closed on
Aug 1, 1992
Sold by
Murphy Gary
Bought by
Mulvoy Terence J and Mulvoy Anne
Home Financials for this Owner
Home Financials are based on the most recent Mortgage that was taken out on this home.
Original Mortgage
$106,000
Interest Rate
7.06%
Create a Home Valuation Report for This Property
The Home Valuation Report is an in-depth analysis detailing your home's value as well as a comparison with similar homes in the area
Purchase History
| Date | Buyer | Sale Price | Title Company |
|---|---|---|---|
| Sosa Noe A | -- | Accommodation | |
| Sosa Noe | $240,000 | Stewart Title | |
| Mulvoy Terence J | -- | Chicago Title Co |
Source: Public Records
Mortgage History
| Date | Status | Borrower | Loan Amount |
|---|---|---|---|
| Open | Sosa Noe A | $255,000 | |
| Closed | Sosa Noe | $192,000 | |
| Previous Owner | Mulvoy Terence J | $106,000 |
Source: Public Records
Tax History
| Year | Tax Paid | Tax Assessment Tax Assessment Total Assessment is a certain percentage of the fair market value that is determined by local assessors to be the total taxable value of land and additions on the property. | Land | Improvement |
|---|---|---|---|---|
| 2025 | $4,826 | $365,819 | $246,991 | $118,828 |
| 2024 | $4,826 | $358,648 | $242,149 | $116,499 |
| 2023 | $4,668 | $351,616 | $237,401 | $114,215 |
| 2022 | $4,441 | $344,723 | $232,747 | $111,976 |
| 2021 | $4,336 | $337,965 | $228,184 | $109,781 |
| 2019 | $4,227 | $327,943 | $221,417 | $106,526 |
| 2018 | $4,053 | $321,514 | $217,076 | $104,438 |
| 2016 | $3,924 | $309,032 | $208,648 | $100,384 |
| 2015 | $3,869 | $304,391 | $205,514 | $98,877 |
| 2014 | $3,659 | $298,430 | $201,489 | $96,941 |
Source: Public Records
Map
Nearby Homes
- 12325 Glynn Ave
- 0 Orange St
- 8324 Alameda St
- 12636 Glynn Ave
- 12143 Downey Ave
- 12135 Downey Ave
- 8444 Albia St
- 8516 Lyndora St
- 12738 Gurley Ave
- 12722 Glynn Ave
- 8502 Borson St
- 7820 Springer St
- 8312 Devenir Ave
- 8254 Stewart And Gray Rd
- 8701 Boyne St
- 12532 Lakewood Blvd Unit 12
- 8041 Puritan St
- 12152 Marbel Ave
- 12148 Marbel Ave
- 8139 Priscilla St
Your Personal Tour Guide
Ask me questions while you tour the home.