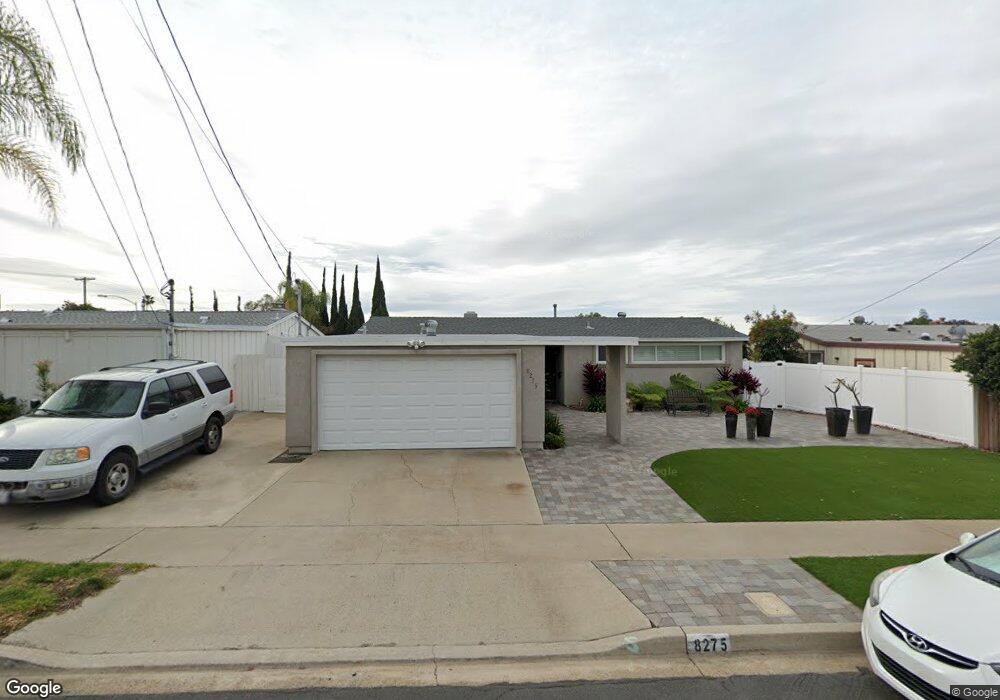
8275 Tommy Dr San Diego, CA 92119
Lake Murray NeighborhoodEstimated Value: $794,000 - $1,029,000
3
Beds
2
Baths
1,200
Sq Ft
$757/Sq Ft
Est. Value
About This Home
This home is located at 8275 Tommy Dr, San Diego, CA 92119 and is currently estimated at $908,160, approximately $756 per square foot. 8275 Tommy Dr is a home located in San Diego County with nearby schools including Gage Elementary School, Pershing Middle School, and Patrick Henry High School.
Ownership History
Date
Name
Owned For
Owner Type
Purchase Details
Closed on
Feb 3, 2020
Sold by
Henrich Mary R
Bought by
Henrich Mary R and Henrich Revocable Livin Mary R
Current Estimated Value
Purchase Details
Closed on
Apr 30, 2002
Sold by
Henrich Mary R
Bought by
Henrich Mary R and Henrich Virginia
Home Financials for this Owner
Home Financials are based on the most recent Mortgage that was taken out on this home.
Original Mortgage
$170,800
Outstanding Balance
$73,389
Interest Rate
7.18%
Estimated Equity
$834,771
Purchase Details
Closed on
Jan 10, 2000
Sold by
Henrich Virginia F
Bought by
Henrich Mary R
Home Financials for this Owner
Home Financials are based on the most recent Mortgage that was taken out on this home.
Original Mortgage
$50,000
Interest Rate
7.87%
Purchase Details
Closed on
May 26, 1987
Create a Home Valuation Report for This Property
The Home Valuation Report is an in-depth analysis detailing your home's value as well as a comparison with similar homes in the area
Home Values in the Area
Average Home Value in this Area
Purchase History
| Date | Buyer | Sale Price | Title Company |
|---|---|---|---|
| Henrich Mary R | -- | None Available | |
| Henrich Mary R | -- | Fidelity National Title Co | |
| Henrich Mary R | -- | North American Title Co | |
| -- | $110,000 | -- |
Source: Public Records
Mortgage History
| Date | Status | Borrower | Loan Amount |
|---|---|---|---|
| Open | Henrich Mary R | $170,800 | |
| Closed | Henrich Mary R | $50,000 |
Source: Public Records
Tax History Compared to Growth
Tax History
| Year | Tax Paid | Tax Assessment Tax Assessment Total Assessment is a certain percentage of the fair market value that is determined by local assessors to be the total taxable value of land and additions on the property. | Land | Improvement |
|---|---|---|---|---|
| 2025 | $3,556 | $294,796 | $147,525 | $147,271 |
| 2024 | $3,556 | $289,017 | $144,633 | $144,384 |
| 2023 | $3,487 | $283,351 | $141,798 | $141,553 |
| 2022 | $3,393 | $277,796 | $139,018 | $138,778 |
| 2021 | $3,368 | $272,350 | $136,293 | $136,057 |
| 2020 | $3,327 | $269,558 | $134,896 | $134,662 |
| 2019 | $3,266 | $264,273 | $132,251 | $132,022 |
| 2018 | $3,053 | $259,092 | $129,658 | $129,434 |
| 2017 | $80 | $254,013 | $127,116 | $126,897 |
| 2016 | $2,929 | $249,033 | $124,624 | $124,409 |
| 2015 | $2,885 | $245,294 | $122,753 | $122,541 |
| 2014 | $2,830 | $240,490 | $120,349 | $120,141 |
Source: Public Records
Map
Nearby Homes
- 8402 Boulder Place
- 8419 Hudson Dr
- 8343 San Carlos Dr
- 8447 Harwell Dr
- 6750 Cowles Mountain Blvd
- 8462 Harwell Dr
- 6548 Bantam Lake Cir
- 6802 Maury Dr
- 8609 Lake Murray Blvd Unit 7
- 8649 Lake Murray Blvd Unit 4
- 8671 Lake Murray Blvd Unit 4
- 8765 Lake Murray Blvd Unit 11
- 8765 Lake Murray Blvd Unit 3
- 8765 Lake Murray Blvd Unit 9
- 7838 Cowles Mountain Ct Unit 18
- 7838 Cowles Mountain Ct Unit C32
- 7838 Cowles Mountain Ct Unit C6
- 8717 Navajo Rd Unit 1
- 8721 Lake Murray Blvd Unit 1
- 7835 Cowles Mountain Ct Unit B6