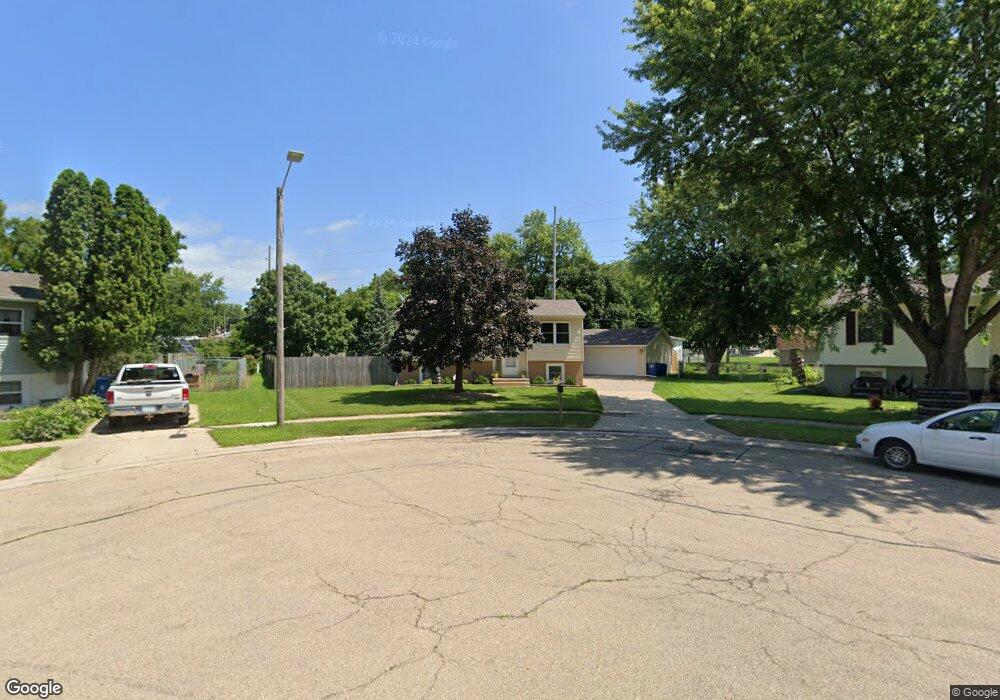
828 13th Ave de Witt, IA 52742
Estimated Value: $205,000 - $247,000
4
Beds
2
Baths
1,514
Sq Ft
$150/Sq Ft
Est. Value
About This Home
This home is located at 828 13th Ave, de Witt, IA 52742 and is currently estimated at $227,409, approximately $150 per square foot. 828 13th Ave is a home located in Clinton County with nearby schools including Ekstrand Elementary School, Central Dewitt Intermediate School, and Central Dewitt Middle School.
Ownership History
Date
Name
Owned For
Owner Type
Purchase Details
Closed on
Feb 28, 2025
Sold by
Devine Megan K and Harris Megan J
Bought by
Sloan Madison A
Current Estimated Value
Home Financials for this Owner
Home Financials are based on the most recent Mortgage that was taken out on this home.
Original Mortgage
$11,675
Outstanding Balance
$9,195
Interest Rate
9.6%
Mortgage Type
New Conventional
Estimated Equity
$218,214
Purchase Details
Closed on
Apr 27, 2010
Sold by
Devine Neal M and Devine Megan J
Bought by
Devine Megan J
Purchase Details
Closed on
Aug 22, 2008
Sold by
Dohrmann Chad A and Dohrmann Patti S
Bought by
Devine Neal M and Devine Megan J
Home Financials for this Owner
Home Financials are based on the most recent Mortgage that was taken out on this home.
Original Mortgage
$116,790
Interest Rate
6.66%
Mortgage Type
New Conventional
Create a Home Valuation Report for This Property
The Home Valuation Report is an in-depth analysis detailing your home's value as well as a comparison with similar homes in the area
Home Values in the Area
Average Home Value in this Area
Purchase History
| Date | Buyer | Sale Price | Title Company |
|---|---|---|---|
| Sloan Madison A | $233,500 | None Listed On Document | |
| Devine Megan J | -- | None Available | |
| Devine Neal M | $113,000 | None Available | |
| Devine Neal M | $113,500 | None Available |
Source: Public Records
Mortgage History
| Date | Status | Borrower | Loan Amount |
|---|---|---|---|
| Open | Sloan Madison A | $11,675 | |
| Open | Sloan Madison A | $227,462 | |
| Previous Owner | Devine Neal M | $116,790 |
Source: Public Records
Tax History Compared to Growth
Tax History
| Year | Tax Paid | Tax Assessment Tax Assessment Total Assessment is a certain percentage of the fair market value that is determined by local assessors to be the total taxable value of land and additions on the property. | Land | Improvement |
|---|---|---|---|---|
| 2025 | $3,148 | $194,000 | $25,150 | $168,850 |
| 2024 | $3,148 | $181,360 | $25,150 | $156,210 |
| 2023 | $2,886 | $181,360 | $25,150 | $156,210 |
| 2022 | $2,630 | $163,000 | $25,150 | $137,850 |
| 2021 | $2,554 | $138,510 | $21,890 | $116,620 |
| 2020 | $2,554 | $128,370 | $21,890 | $106,480 |
| 2019 | $2,446 | $123,300 | $0 | $0 |
| 2018 | $2,384 | $123,300 | $0 | $0 |
| 2017 | $2,384 | $123,300 | $0 | $0 |
| 2016 | $2,210 | $0 | $0 | $0 |
| 2015 | $2,210 | $114,800 | $0 | $0 |
| 2014 | $2,238 | $114,800 | $0 | $0 |
| 2013 | $2,200 | $0 | $0 | $0 |
Source: Public Records
Map
Nearby Homes