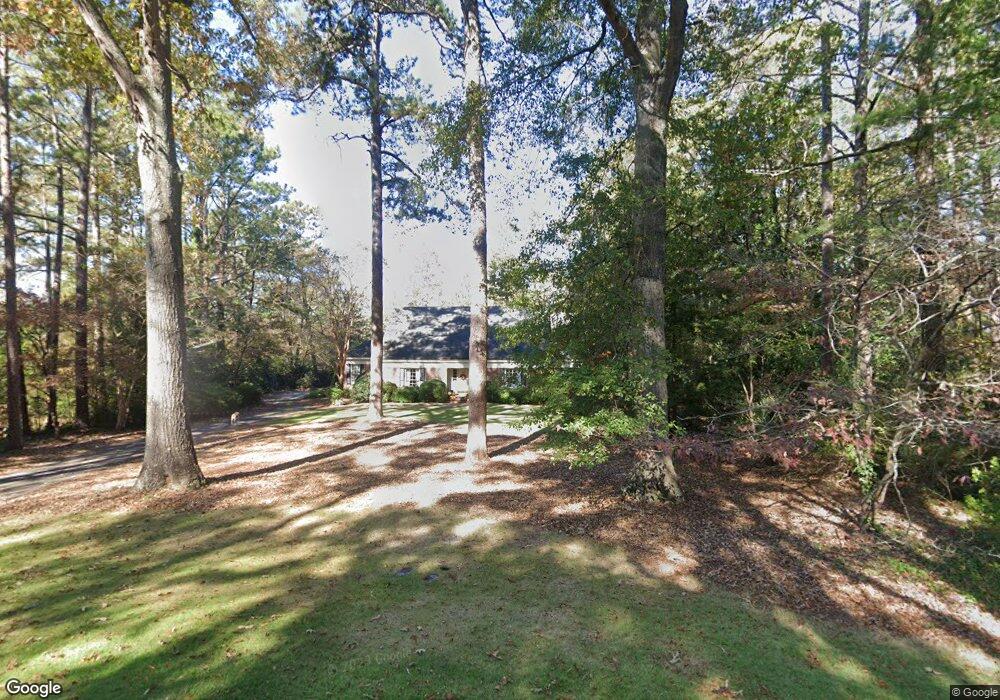
828 Cherokee Rd Lagrange, GA 30240
Estimated Value: $324,000 - $435,000
4
Beds
3
Baths
2,892
Sq Ft
$130/Sq Ft
Est. Value
About This Home
This home is located at 828 Cherokee Rd, Lagrange, GA 30240 and is currently estimated at $377,207, approximately $130 per square foot. 828 Cherokee Rd is a home located in Troup County with nearby schools including Hollis Hand Elementary School, Franklin Forest Elementary School, and Ethel W. Kight Elementary School.
Ownership History
Date
Name
Owned For
Owner Type
Purchase Details
Closed on
Mar 15, 2023
Sold by
Holle Mary Page Sargent
Bought by
Butts Ellen H and Butts James F
Current Estimated Value
Home Financials for this Owner
Home Financials are based on the most recent Mortgage that was taken out on this home.
Original Mortgage
$115,000
Outstanding Balance
$111,131
Interest Rate
6.32%
Mortgage Type
New Conventional
Estimated Equity
$266,076
Purchase Details
Closed on
Mar 20, 1998
Sold by
William F Holle
Bought by
Holle Mary Page Sargent
Purchase Details
Closed on
Mar 2, 1978
Sold by
Eleanor Johnson
Bought by
William F Holle
Purchase Details
Closed on
Mar 31, 1975
Sold by
Lag College
Bought by
Eleanor Johnson
Purchase Details
Closed on
Sep 20, 1974
Sold by
Johnson Fd
Bought by
Lag College
Purchase Details
Closed on
Jan 1, 1952
Sold by
Ida C Callaway Fd
Bought by
Johnson Fd
Create a Home Valuation Report for This Property
The Home Valuation Report is an in-depth analysis detailing your home's value as well as a comparison with similar homes in the area
Purchase History
| Date | Buyer | Sale Price | Title Company |
|---|---|---|---|
| Butts Ellen H | $280,000 | -- | |
| Holle Mary Page Sargent | -- | -- | |
| William F Holle | $18,500 | -- | |
| Eleanor Johnson | -- | -- | |
| Lag College | -- | -- | |
| Johnson Fd | -- | -- |
Source: Public Records
Mortgage History
| Date | Status | Borrower | Loan Amount |
|---|---|---|---|
| Open | Butts Ellen H | $115,000 |
Source: Public Records
Tax History
| Year | Tax Paid | Tax Assessment Tax Assessment Total Assessment is a certain percentage of the fair market value that is determined by local assessors to be the total taxable value of land and additions on the property. | Land | Improvement |
|---|---|---|---|---|
| 2025 | $4,153 | $152,280 | $18,000 | $134,280 |
| 2024 | $3,448 | $126,440 | $18,000 | $108,440 |
| 2023 | $3,396 | $124,520 | $18,000 | $106,520 |
| 2022 | $3,208 | $116,920 | $18,000 | $98,920 |
| 2021 | $3,143 | $106,200 | $18,000 | $88,200 |
| 2020 | $3,143 | $106,200 | $18,000 | $88,200 |
| 2019 | $2,472 | $83,960 | $12,880 | $71,080 |
| 2018 | $2,370 | $80,560 | $12,880 | $67,680 |
| 2017 | $2,341 | $79,593 | $10,633 | $68,960 |
| 2016 | $2,385 | $81,063 | $10,633 | $70,430 |
| 2015 | $2,458 | $83,326 | $12,896 | $70,430 |
| 2014 | $2,418 | $81,874 | $12,896 | $68,978 |
| 2013 | -- | $79,782 | $12,548 | $67,234 |
Source: Public Records
Map
Nearby Homes
- 420 Ridgecrest Rd
- 705 Piney Woods Dr
- 724 Camellia Dr
- 203 S Chilton Crescent
- 201 S Chilton Crescent
- 732 Camellia Dr
- 106 Ewing St
- 216 E Lane Cir
- 0 Hills and Dales Farm Rd
- 222 Beechwood Cir
- 105 Saynor Cir
- 203 Waverly Way
- 109 Thomas St
- 219 Banks St
- 102 Beech Creek Dr
- 900 North St
- 110 Russell St
- 118 Highland Ave
- 204 Colonial St
- 204 Dixie Creek Dr
- 826 Cherokee Rd
- 830 Cherokee Rd
- 881 Piney Woods Dr
- 853 Piney Woods Dr
- 855 Piney Woods Dr
- 847 Piney Woods Dr
- 820 Cherokee Rd
- 832 Cherokee Rd
- 901 Piney Woods Dr
- 815 Cherokee Rd
- 845 Piney Woods Dr
- 882 Piney Woods Dr
- 848 Piney Woods Dr
- 814 Cherokee Rd
- 856 Piney Woods Dr
- 858 Piney Woods Dr
- 903 Piney Woods Dr
- 890 Piney Woods Dr
- 846 Piney Woods Dr
- 860 Piney Woods Dr
Your Personal Tour Guide
Ask me questions while you tour the home.