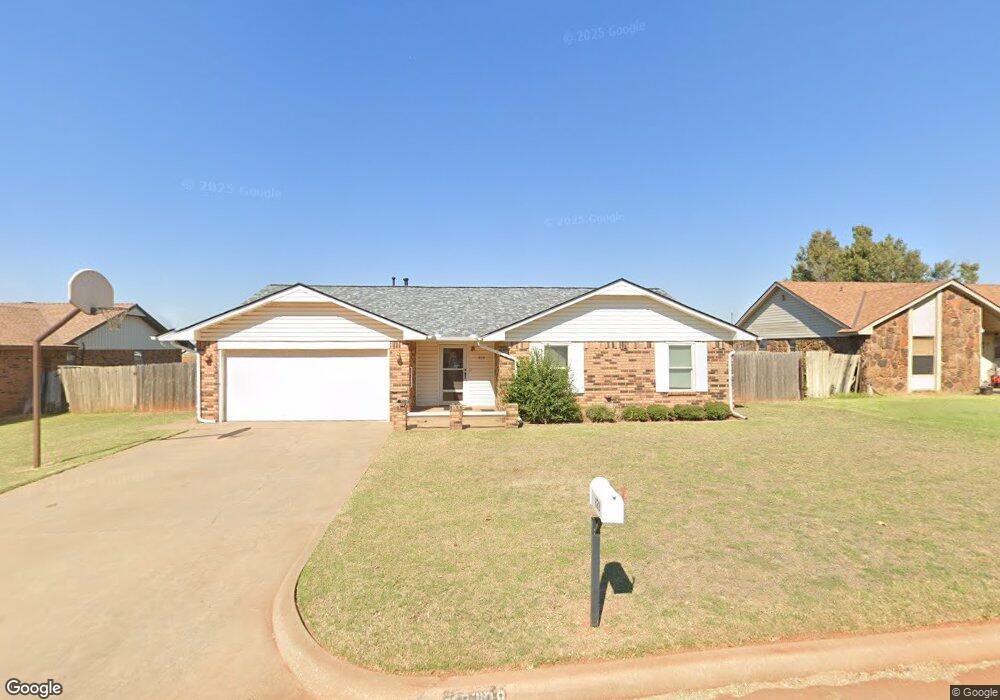
828 Clark Dr Kingfisher, OK 73750
Estimated Value: $206,870 - $263,000
3
Beds
2
Baths
1,551
Sq Ft
$154/Sq Ft
Est. Value
About This Home
This home is located at 828 Clark Dr, Kingfisher, OK 73750 and is currently estimated at $238,468, approximately $153 per square foot. 828 Clark Dr is a home located in Kingfisher County with nearby schools including Gilmour Elementary School, Kingfisher Middle School, and Kingfisher High School.
Ownership History
Date
Name
Owned For
Owner Type
Purchase Details
Closed on
May 19, 2008
Sold by
Phillips Sandra Kay
Bought by
Adams Francis P and Adams Penelope J
Current Estimated Value
Home Financials for this Owner
Home Financials are based on the most recent Mortgage that was taken out on this home.
Original Mortgage
$70,000
Outstanding Balance
$44,157
Interest Rate
5.89%
Mortgage Type
New Conventional
Estimated Equity
$194,311
Purchase Details
Closed on
Dec 20, 2007
Sold by
Jones Paul R and Jones Dorothy M
Bought by
Phillips Sandra Kay
Home Financials for this Owner
Home Financials are based on the most recent Mortgage that was taken out on this home.
Original Mortgage
$130,114
Interest Rate
6.23%
Mortgage Type
Purchase Money Mortgage
Purchase Details
Closed on
Apr 6, 2007
Sold by
Lippoldt Thomas J and Lippoldt Beverly Gail
Bought by
Jones Paul R
Create a Home Valuation Report for This Property
The Home Valuation Report is an in-depth analysis detailing your home's value as well as a comparison with similar homes in the area
Home Values in the Area
Average Home Value in this Area
Purchase History
| Date | Buyer | Sale Price | Title Company |
|---|---|---|---|
| Adams Francis P | $130,000 | None Available | |
| Phillips Sandra Kay | $126,000 | None Available | |
| Jones Paul R | $107,500 | None Available |
Source: Public Records
Mortgage History
| Date | Status | Borrower | Loan Amount |
|---|---|---|---|
| Open | Adams Francis P | $70,000 | |
| Previous Owner | Phillips Sandra Kay | $130,114 |
Source: Public Records
Tax History Compared to Growth
Tax History
| Year | Tax Paid | Tax Assessment Tax Assessment Total Assessment is a certain percentage of the fair market value that is determined by local assessors to be the total taxable value of land and additions on the property. | Land | Improvement |
|---|---|---|---|---|
| 2025 | $1,448 | $18,008 | $2,129 | $15,879 |
| 2024 | $1,448 | $18,009 | $1,940 | $16,069 |
| 2023 | $1,448 | $18,009 | $1,760 | $16,249 |
| 2022 | $1,476 | $18,009 | $1,760 | $16,249 |
| 2021 | $1,488 | $18,009 | $1,760 | $16,249 |
| 2020 | $1,482 | $18,009 | $1,760 | $16,249 |
| 2019 | $1,389 | $17,562 | $1,685 | $15,877 |
| 2018 | $1,344 | $17,051 | $1,712 | $15,339 |
| 2017 | $1,370 | $16,554 | $1,672 | $14,882 |
| 2016 | $1,383 | $15,766 | $1,601 | $14,165 |
| 2015 | $1,323 | $15,014 | $588 | $14,426 |
| 2014 | $1,293 | $14,300 | $2,200 | $12,100 |
Source: Public Records
Map
Nearby Homes
- 904 N Park Place
- 912 W Overstreet Ave
- 806 Chateau Ct
- 602 W Oklahoma Ave
- 1202 S 13th St
- 722 S 10th St
- 723 S 9th St
- 1102 S 9th St
- 1012 S 8th St
- 1303 S 10th St
- 1302 S 8th St
- 504 S Main St
- 1212 S Main St
- 602 S 6th St
- 0000000 Oklahoma 33
- 212 E Oklahoma Ave
- 226 E Oklahoma Ave
- 309 S 6th St
- 209 E Don Blanding Ave
- 1907 Five Springs Ct