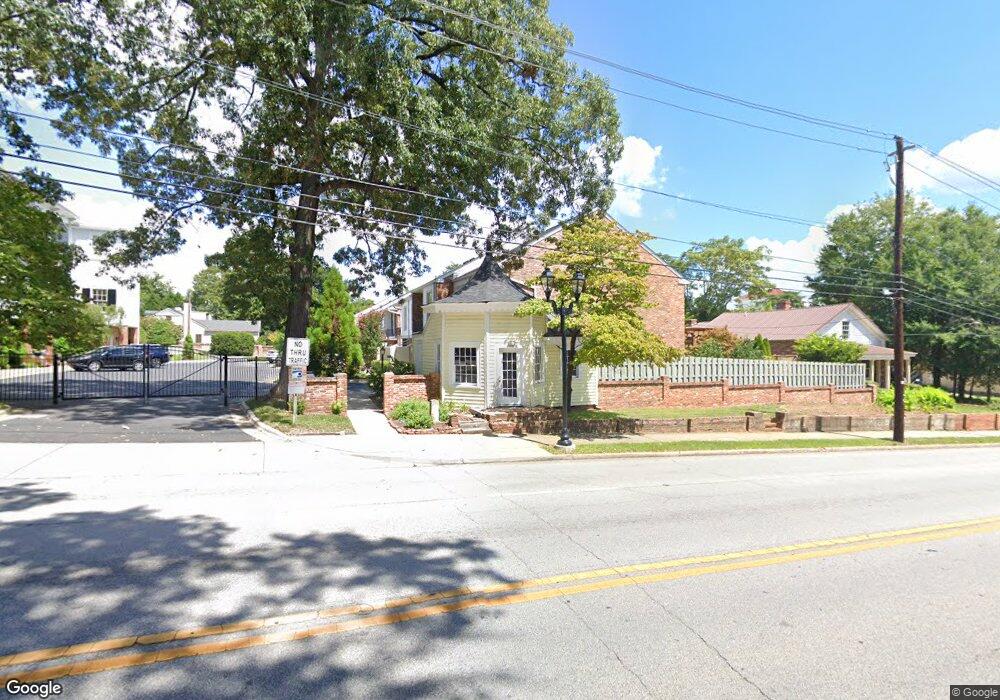
828 Milledge Rd Unit C2 Augusta, GA 30904
Summerville NeighborhoodEstimated Value: $261,000 - $310,000
3
Beds
3
Baths
1,800
Sq Ft
$160/Sq Ft
Est. Value
About This Home
This home is located at 828 Milledge Rd Unit C2, Augusta, GA 30904 and is currently estimated at $287,668, approximately $159 per square foot. 828 Milledge Rd Unit C2 is a home located in Richmond County with nearby schools including R.B. Hunt Elementary School, Lake Forest Hills Elementary School, and Langford Middle School.
Ownership History
Date
Name
Owned For
Owner Type
Purchase Details
Closed on
Feb 8, 2013
Sold by
Marks Carol Ann
Bought by
Girardi David D and Girardi Jane C
Current Estimated Value
Home Financials for this Owner
Home Financials are based on the most recent Mortgage that was taken out on this home.
Original Mortgage
$110,400
Outstanding Balance
$76,976
Interest Rate
3.43%
Mortgage Type
New Conventional
Estimated Equity
$210,692
Purchase Details
Closed on
Dec 2, 2011
Sold by
Tompkins Jason Kyle
Bought by
Marks Carol Ann
Home Financials for this Owner
Home Financials are based on the most recent Mortgage that was taken out on this home.
Original Mortgage
$87,000
Interest Rate
4.06%
Mortgage Type
New Conventional
Purchase Details
Closed on
May 17, 2004
Sold by
Schadek Elinor P
Bought by
Tompkins Jason Kyle
Home Financials for this Owner
Home Financials are based on the most recent Mortgage that was taken out on this home.
Original Mortgage
$107,100
Interest Rate
5.77%
Mortgage Type
Purchase Money Mortgage
Create a Home Valuation Report for This Property
The Home Valuation Report is an in-depth analysis detailing your home's value as well as a comparison with similar homes in the area
Home Values in the Area
Average Home Value in this Area
Purchase History
| Date | Buyer | Sale Price | Title Company |
|---|---|---|---|
| Girardi David D | $138,000 | -- | |
| Marks Carol Ann | $132,000 | -- | |
| Tompkins Jason Kyle | $119,000 | -- |
Source: Public Records
Mortgage History
| Date | Status | Borrower | Loan Amount |
|---|---|---|---|
| Open | Girardi David D | $110,400 | |
| Previous Owner | Marks Carol Ann | $87,000 | |
| Previous Owner | Tompkins Jason Kyle | $107,100 |
Source: Public Records
Tax History Compared to Growth
Tax History
| Year | Tax Paid | Tax Assessment Tax Assessment Total Assessment is a certain percentage of the fair market value that is determined by local assessors to be the total taxable value of land and additions on the property. | Land | Improvement |
|---|---|---|---|---|
| 2025 | $3,229 | $98,368 | $16,000 | $82,368 |
| 2024 | $3,229 | $111,860 | $16,000 | $95,860 |
| 2023 | $3,548 | $108,236 | $16,000 | $92,236 |
| 2022 | $2,825 | $82,228 | $16,000 | $66,228 |
| 2021 | $2,685 | $70,714 | $16,000 | $54,714 |
| 2020 | $2,133 | $55,165 | $9,000 | $46,165 |
| 2019 | $2,264 | $55,165 | $9,000 | $46,165 |
| 2018 | $2,282 | $55,165 | $9,000 | $46,165 |
| 2017 | $2,270 | $55,165 | $9,000 | $46,165 |
| 2016 | $2,271 | $55,165 | $9,000 | $46,165 |
| 2015 | $2,286 | $55,165 | $9,000 | $46,165 |
| 2014 | $2,288 | $55,165 | $9,000 | $46,165 |
Source: Public Records
Map
Nearby Homes
- 2213 Clayton Ln
- 2211 Clayton Ln
- 2207 Clayton Ln
- 2203 Clayton Ln
- 2201 Clayton Ln
- 2110 Carnes Place
- 946 Milledge Rd
- 1010 Hickman Rd Unit B5
- 1010 Hickman Rd Unit B3
- 1010 Hickman Rd Unit A2
- 844 Heard Ave
- 2204 Gardner St
- 930 Heard Ave
- 705 Hickman Rd
- 2232 Mcdowell St
- 729 Heard Ave
- 803 Russell St
- 2016 Hampton Ave
- 812 Russell St
- 828 Milledge Rd Unit A-2
- 828 Milledge Rd Unit 3
- 828 Milledge Rd
- 828 Milledge Rd Unit C1
- 828 Milledge Rd Unit B4
- 828 Milledge Rd
- 828 Milledge Rd Unit B2
- 828 Milledge Rd Unit B1
- 828 Milledge Rd Unit A3
- 828 Milledge Rd
- 828 Milledge Rd Unit A1
- 828 Milledge Rd
- 828 Milledge Rd Unit 1
- 828 Milledge Rd Unit C-3
- 828 Milledge Rd Unit C-4
- 2137 Walton Way
- 2131 Walton Way
- 824 Milledge Rd
- 912 Milledge Rd
- 820 Milledge Rd