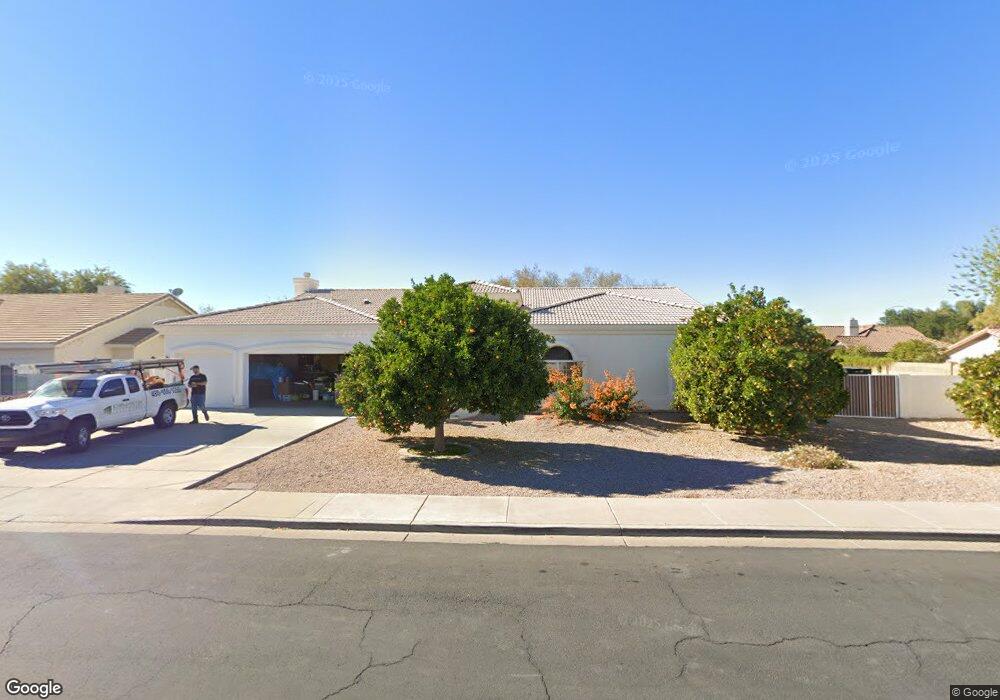
828 N 46th St Mesa, AZ 85205
Central Mesa East NeighborhoodEstimated Value: $713,000 - $830,000
4
Beds
3
Baths
3,018
Sq Ft
$256/Sq Ft
Est. Value
About This Home
This home is located at 828 N 46th St, Mesa, AZ 85205 and is currently estimated at $772,516, approximately $255 per square foot. 828 N 46th St is a home located in Maricopa County with nearby schools including O'Connor Elementary School, Franklin at Brimhall Elementary School, and Franklin West Elementary School.
Ownership History
Date
Name
Owned For
Owner Type
Purchase Details
Closed on
Mar 5, 2025
Sold by
Mesa Land Investments Llc
Bought by
Fillmore Brian and Fillmore Jill
Current Estimated Value
Purchase Details
Closed on
May 19, 2015
Sold by
Locy Gerald R and Locy Connie M
Bought by
Investments Llc
Purchase Details
Closed on
Oct 21, 1997
Sold by
Ertefai Hamid R and Ertefai Wendy M
Bought by
Locy Gerald R and Locy Connie M
Home Financials for this Owner
Home Financials are based on the most recent Mortgage that was taken out on this home.
Original Mortgage
$195,600
Interest Rate
7.3%
Mortgage Type
New Conventional
Purchase Details
Closed on
Jun 13, 1994
Sold by
Harder Jean M
Bought by
Ertefai Hamid R and Ertefai Wendy M
Create a Home Valuation Report for This Property
The Home Valuation Report is an in-depth analysis detailing your home's value as well as a comparison with similar homes in the area
Home Values in the Area
Average Home Value in this Area
Purchase History
| Date | Buyer | Sale Price | Title Company |
|---|---|---|---|
| Fillmore Brian | -- | None Listed On Document | |
| Investments Llc | $315,000 | Chicago Title Agency Inc | |
| Locy Gerald R | $244,500 | Security Title Agency | |
| Ertefai Hamid R | $39,450 | First Service Title Agency |
Source: Public Records
Mortgage History
| Date | Status | Borrower | Loan Amount |
|---|---|---|---|
| Previous Owner | Locy Gerald R | $195,600 |
Source: Public Records
Tax History
| Year | Tax Paid | Tax Assessment Tax Assessment Total Assessment is a certain percentage of the fair market value that is determined by local assessors to be the total taxable value of land and additions on the property. | Land | Improvement |
|---|---|---|---|---|
| 2025 | $3,873 | $38,568 | -- | -- |
| 2024 | $3,885 | $36,732 | -- | -- |
| 2023 | $3,885 | $49,930 | $9,980 | $39,950 |
| 2022 | $3,806 | $40,860 | $8,170 | $32,690 |
| 2021 | $3,840 | $40,110 | $8,020 | $32,090 |
| 2020 | $3,789 | $35,380 | $7,070 | $28,310 |
| 2019 | $3,543 | $33,720 | $6,740 | $26,980 |
| 2018 | $3,398 | $32,220 | $6,440 | $25,780 |
| 2017 | $3,298 | $31,770 | $6,350 | $25,420 |
| 2016 | $3,223 | $31,820 | $6,360 | $25,460 |
| 2015 | $3,038 | $30,130 | $6,020 | $24,110 |
Source: Public Records
Map
Nearby Homes
- 4556 E Downing St
- 4562 E Elmwood St
- 4449 E Elmwood St
- 4429 E Downing Cir
- 4650 E Decatur St
- 4530 E Decatur St
- 4933 E Downing St
- 4335 E Fox Cir
- 4749 E Contessa St
- 4958 E Dartmouth St
- 4913 E Fox St
- 4326 E Fairbrook Cir
- 5051 E Adobe St
- 5135 E Evergreen St Unit 1253
- 5056 E Dallas St
- 4906 E Brown Rd Unit 38
- 5033 E Colby St
- 5011 E Greenway St
- 5207 E Dodge St
- 4147 E Glencove Cir
- 816 N Quail Cir
- 831 S Quinn
- 4561 E Enrose St
- 819 S Quinn
- 4553 E Enrose St
- 4619 E Enrose Cir
- 804 N Quail Cir
- 807 N Quinn Cir
- 4621 E Ellis Cir
- 832 N Quinn Cir
- 4545 E Enrose St
- 820 N Quinn Cir
- 4560 E Enrose St Unit 63
- 4606 E Enrose Cir
- 4631 E Enrose Cir
- 4636 E Ellis Cir
- 4552 E Enrose St
- 808 N Quinn Cir
- 4633 E Ellis Cir
- 4628 E Enrose Cir
Your Personal Tour Guide
Ask me questions while you tour the home.