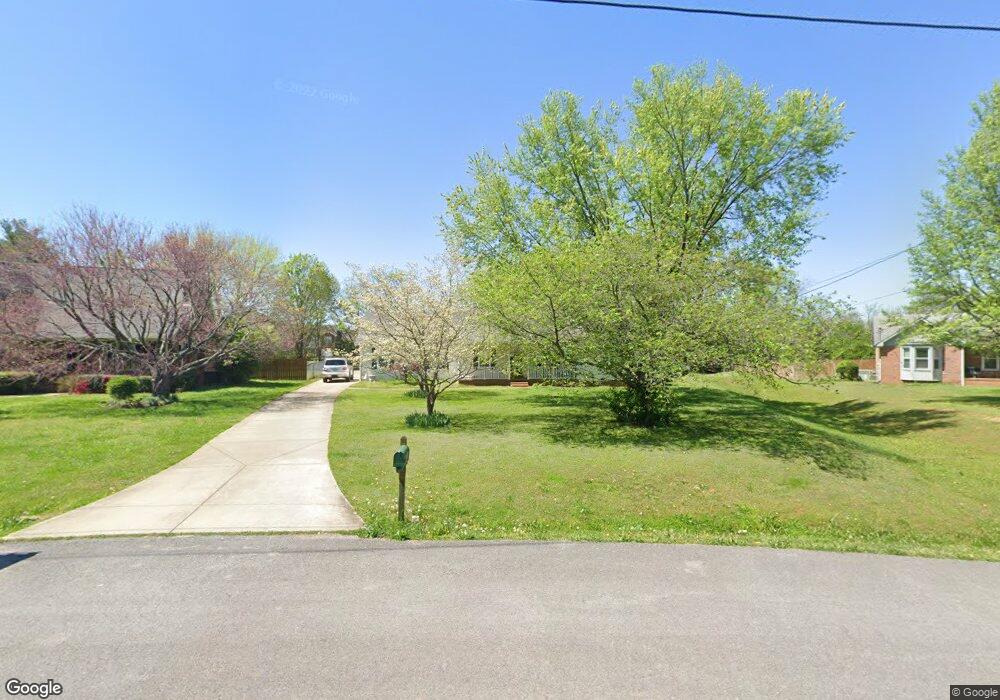
828 Spike Trail Murfreesboro, TN 37129
Estimated Value: $384,542 - $434,000
--
Bed
2
Baths
2,137
Sq Ft
$194/Sq Ft
Est. Value
About This Home
This home is located at 828 Spike Trail, Murfreesboro, TN 37129 and is currently estimated at $415,386, approximately $194 per square foot. 828 Spike Trail is a home located in Rutherford County with nearby schools including Blackman Elementary School, Blackman Middle School, and Blackman High School.
Ownership History
Date
Name
Owned For
Owner Type
Purchase Details
Closed on
Jul 26, 2016
Sold by
Darnall Andrew Lindsey
Bought by
Darnall Yoshie Tsurumi
Current Estimated Value
Home Financials for this Owner
Home Financials are based on the most recent Mortgage that was taken out on this home.
Original Mortgage
$70,000
Outstanding Balance
$7,476
Interest Rate
3.48%
Mortgage Type
New Conventional
Estimated Equity
$407,910
Purchase Details
Closed on
Dec 29, 2003
Sold by
Alfred Kenneth M and Alfred Wendy L
Bought by
Darnall Andrew L
Home Financials for this Owner
Home Financials are based on the most recent Mortgage that was taken out on this home.
Original Mortgage
$108,450
Interest Rate
5.82%
Purchase Details
Closed on
Sep 3, 1999
Sold by
Bromley Jeff T
Bought by
Allred Kenneth M and Allred Leigh B
Home Financials for this Owner
Home Financials are based on the most recent Mortgage that was taken out on this home.
Original Mortgage
$100,400
Interest Rate
7.73%
Purchase Details
Closed on
May 1, 1995
Sold by
Goins Sherrie L
Bought by
Bromley Jeff T
Purchase Details
Closed on
Aug 10, 1994
Sold by
Scott Goins Steven
Bought by
Goins Sherrie L
Create a Home Valuation Report for This Property
The Home Valuation Report is an in-depth analysis detailing your home's value as well as a comparison with similar homes in the area
Home Values in the Area
Average Home Value in this Area
Purchase History
| Date | Buyer | Sale Price | Title Company |
|---|---|---|---|
| Darnall Yoshie Tsurumi | -- | None Available | |
| Darnall Andrew L | $120,500 | -- | |
| Allred Kenneth M | $104,000 | -- | |
| Bromley Jeff T | $8,500 | -- | |
| Goins Sherrie L | -- | -- |
Source: Public Records
Mortgage History
| Date | Status | Borrower | Loan Amount |
|---|---|---|---|
| Open | Darnall Yoshie Tsurumi | $70,000 | |
| Closed | Goins Sherrie L | $108,450 | |
| Previous Owner | Goins Sherrie L | $100,400 |
Source: Public Records
Tax History Compared to Growth
Tax History
| Year | Tax Paid | Tax Assessment Tax Assessment Total Assessment is a certain percentage of the fair market value that is determined by local assessors to be the total taxable value of land and additions on the property. | Land | Improvement |
|---|---|---|---|---|
| 2025 | $1,456 | $77,625 | $13,750 | $63,875 |
| 2024 | $1,456 | $77,625 | $13,750 | $63,875 |
| 2023 | $1,456 | $77,625 | $13,750 | $63,875 |
| 2022 | $1,255 | $77,625 | $13,750 | $63,875 |
| 2021 | $1,228 | $55,325 | $9,250 | $46,075 |
| 2020 | $1,228 | $55,325 | $9,250 | $46,075 |
| 2019 | $1,228 | $55,325 | $9,250 | $46,075 |
| 2018 | $1,161 | $55,325 | $0 | $0 |
| 2017 | $1,078 | $40,225 | $0 | $0 |
| 2016 | $1,078 | $40,225 | $0 | $0 |
| 2015 | $1,078 | $40,225 | $0 | $0 |
| 2014 | $1,000 | $40,225 | $0 | $0 |
| 2013 | -- | $37,250 | $0 | $0 |
Source: Public Records
Map
Nearby Homes
- 3718 Red Willow Ct
- 1036 Wolves Den Place
- 3726 Selina Dr
- 928 Sitting Bull Crossing
- 1022 Sitting Bull Crossing
- 3750 Chippewa Place
- 924 Sitting Bull Crossing
- 1028 Shaman Crossing
- 3927 Cannonsgate Ln
- 913 Battleview Place
- 3741 Southbend Dr
- 4010 Cannonsgate Ln
- 621 Buck Ln
- 917 Round Dr
- 920 Manson Crossing Dr
- 929 Manson Crossing Dr
- 478 Deerfield Dr
- 411 Campfire Dr
- 616 Foxfire Ct
- 905 Thunder Gulch Way
- 822 Spike Trail
- 834 Spike Trail
- 3714 Iron Horse Ct
- 3716 Iron Horse Ct
- 3713 Red Cloud Ct
- 3718 Iron Horse Ct
- 3715 Alchemy Ct Unit 1233
- 3715 Alchemy Ct
- 3720 Iron Horse Ct
- 3717 Alchemy Ct
- 3717 Red Cloud Ct
- 3722 Iron Horse Ct
- 816 Spike Trail
- 3719 Alchemy Ct
- 840 Spike Trail
- 3721 Alchemy Ct
- 3712 Red Willow Ct
- 3714 Red Willow Ct
- 3723 Alchemy Ct
- 835 Spike Trail