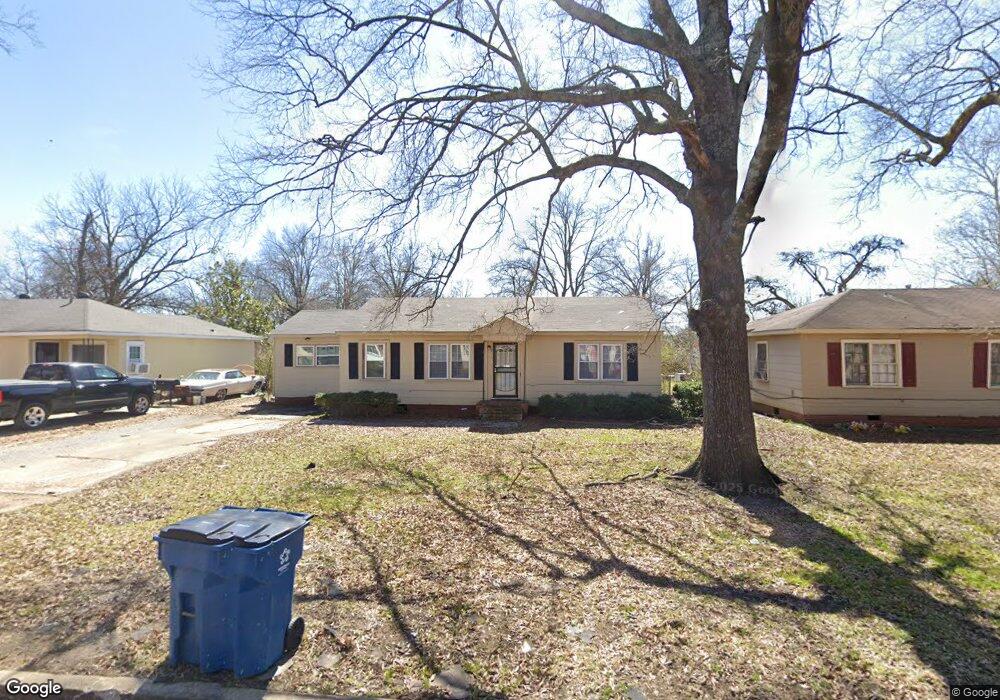
828 Vincent St Clarksdale, MS 38614
Estimated Value: $36,000 - $57,000
3
Beds
1
Bath
1,404
Sq Ft
$35/Sq Ft
Est. Value
About This Home
This home is located at 828 Vincent St, Clarksdale, MS 38614 and is currently estimated at $49,297, approximately $35 per square foot. 828 Vincent St is a home with nearby schools including Clarksdale High School, Clarksdale Collegiate, and Presbyterian Day School.
Ownership History
Date
Name
Owned For
Owner Type
Purchase Details
Closed on
Nov 4, 2005
Sold by
Colvin Kit
Bought by
Griffin April
Current Estimated Value
Home Financials for this Owner
Home Financials are based on the most recent Mortgage that was taken out on this home.
Original Mortgage
$48,000
Outstanding Balance
$26,075
Interest Rate
5.9%
Estimated Equity
$23,222
Purchase Details
Closed on
Sep 28, 2005
Sold by
Secretary Of Housing And Urban Dev
Bought by
Colvin Kit
Home Financials for this Owner
Home Financials are based on the most recent Mortgage that was taken out on this home.
Original Mortgage
$48,000
Outstanding Balance
$26,075
Interest Rate
5.9%
Estimated Equity
$23,222
Purchase Details
Closed on
Jun 30, 2005
Sold by
Mortgage Electronic Registration
Bought by
Secretary Of Housing And Urban Dev
Purchase Details
Closed on
May 26, 2005
Sold by
Adams Lem and Hutchens Charlie N
Bought by
Mortgage Electronic Registration
Create a Home Valuation Report for This Property
The Home Valuation Report is an in-depth analysis detailing your home's value as well as a comparison with similar homes in the area
Home Values in the Area
Average Home Value in this Area
Purchase History
| Date | Buyer | Sale Price | Title Company |
|---|---|---|---|
| Griffin April | -- | -- | |
| Colvin Kit | -- | -- | |
| Secretary Of Housing And Urban Dev | -- | -- | |
| Mortgage Electronic Registration | -- | -- |
Source: Public Records
Mortgage History
| Date | Status | Borrower | Loan Amount |
|---|---|---|---|
| Open | Griffin April | $48,000 |
Source: Public Records
Tax History Compared to Growth
Tax History
| Year | Tax Paid | Tax Assessment Tax Assessment Total Assessment is a certain percentage of the fair market value that is determined by local assessors to be the total taxable value of land and additions on the property. | Land | Improvement |
|---|---|---|---|---|
| 2024 | $1,098 | $4,784 | $1,035 | $3,749 |
| 2023 | $1,074 | $4,784 | $1,035 | $3,749 |
| 2022 | $1,078 | $4,784 | $1,035 | $3,749 |
| 2021 | $1,037 | $4,650 | $1,035 | $3,615 |
| 2020 | $1,226 | $5,554 | $1,035 | $4,519 |
| 2019 | $642 | $3,703 | $690 | $3,013 |
| 2018 | $623 | $3,703 | $690 | $3,013 |
| 2017 | $0 | $3,479 | $690 | $2,789 |
| 2016 | $501 | $3,479 | $690 | $2,789 |
| 2015 | -- | $3,479 | $690 | $2,789 |
| 2014 | -- | $3,479 | $690 | $2,789 |
| 2013 | -- | $3,494 | $805 | $2,689 |
Source: Public Records
Map
Nearby Homes
- 901 Westhaven Cir
- 835 Catalpa St
- 621 School St
- 711 Catalpa St
- 607 W 2nd St
- 11 Oak Knoll Dr
- 1443 Shady Ln
- 1512 Broad St
- 1120 Rose Cir
- 1524 Linden Place
- 813 Cuyahoga St
- 1304 Buena Vista St
- 236 Maple Ave
- 956 Oakhurst Ave
- 340 Elm Ave
- 155 W 2nd St
- 418 Cypress Ave
- 816 Cherokee St
- 1577 Azalea St
- 1576 Wisteria Dr