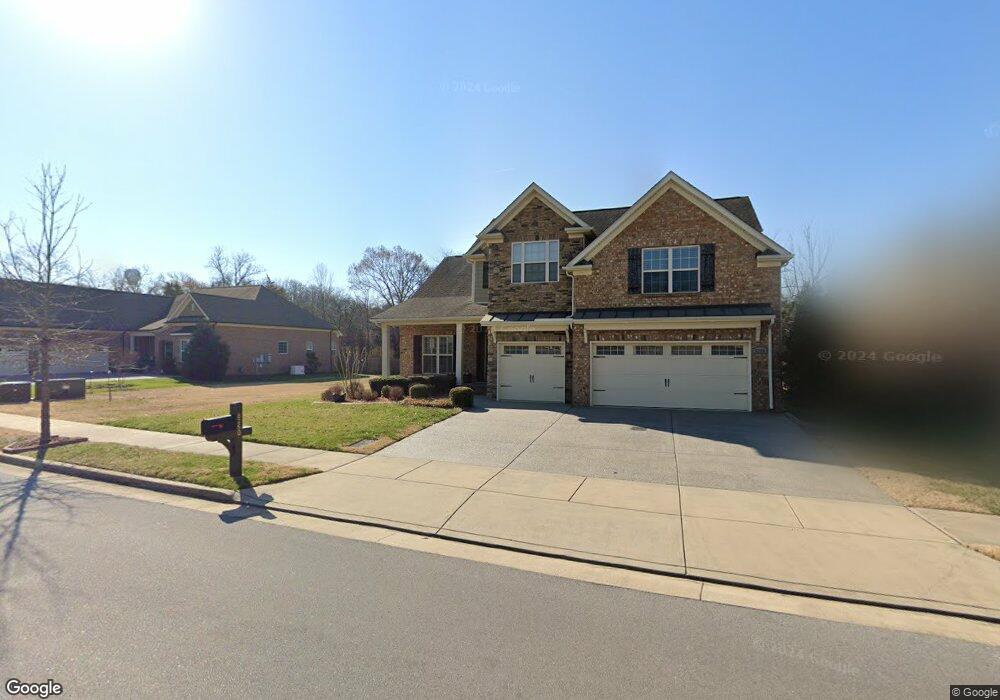
8280 Middlewick Ln Nolensville, TN 37135
Estimated Value: $785,000 - $850,806
4
Beds
3
Baths
2,875
Sq Ft
$284/Sq Ft
Est. Value
About This Home
This home is located at 8280 Middlewick Ln, Nolensville, TN 37135 and is currently estimated at $815,952, approximately $283 per square foot. 8280 Middlewick Ln is a home located in Williamson County with nearby schools including Nolensville Elementary School, Mill Creek Middle School, and Nolensville High School.
Ownership History
Date
Name
Owned For
Owner Type
Purchase Details
Closed on
Mar 24, 2023
Sold by
Patel Jayanti and Patel Ushaben
Bought by
Jayanti Khushaldas Patel And Ushaben Jayanti
Current Estimated Value
Purchase Details
Closed on
Jun 28, 2016
Sold by
Caron Carolyn and Caron Paul A
Bought by
Patel Jayanti and Patel Ushaben
Home Financials for this Owner
Home Financials are based on the most recent Mortgage that was taken out on this home.
Original Mortgage
$343,920
Interest Rate
2.87%
Mortgage Type
Adjustable Rate Mortgage/ARM
Purchase Details
Closed on
May 6, 2014
Sold by
Regent Homes Llc
Bought by
Cronin Carolyn and Cronin Paul A
Home Financials for this Owner
Home Financials are based on the most recent Mortgage that was taken out on this home.
Original Mortgage
$80,000
Interest Rate
3.39%
Mortgage Type
New Conventional
Create a Home Valuation Report for This Property
The Home Valuation Report is an in-depth analysis detailing your home's value as well as a comparison with similar homes in the area
Home Values in the Area
Average Home Value in this Area
Purchase History
| Date | Buyer | Sale Price | Title Company |
|---|---|---|---|
| Jayanti Khushaldas Patel And Ushaben Jayanti | -- | -- | |
| Patel Jayanti | $429,900 | Foundation Title & Escrow | |
| Cronin Carolyn | $405,000 | None Available |
Source: Public Records
Mortgage History
| Date | Status | Borrower | Loan Amount |
|---|---|---|---|
| Previous Owner | Patel Jayanti | $343,920 | |
| Previous Owner | Cronin Carolyn | $80,000 |
Source: Public Records
Tax History Compared to Growth
Tax History
| Year | Tax Paid | Tax Assessment Tax Assessment Total Assessment is a certain percentage of the fair market value that is determined by local assessors to be the total taxable value of land and additions on the property. | Land | Improvement |
|---|---|---|---|---|
| 2025 | $2,833 | $205,675 | $53,750 | $151,925 |
| 2024 | $2,833 | $130,550 | $30,000 | $100,550 |
| 2023 | $2,833 | $130,550 | $30,000 | $100,550 |
| 2022 | $2,833 | $130,550 | $30,000 | $100,550 |
| 2021 | $2,833 | $130,550 | $30,000 | $100,550 |
| 2020 | $2,734 | $108,925 | $21,250 | $87,675 |
| 2019 | $2,581 | $108,925 | $21,250 | $87,675 |
| 2018 | $2,505 | $108,925 | $21,250 | $87,675 |
| 2017 | $2,436 | $106,850 | $21,250 | $85,600 |
| 2016 | $2,404 | $106,850 | $21,250 | $85,600 |
| 2015 | -- | $94,700 | $18,750 | $75,950 |
| 2014 | -- | $64,175 | $18,750 | $45,425 |
Source: Public Records
Map
Nearby Homes
- 2186 Kirkwall Dr
- 1012 Sinatra Dr
- 1047 Sinatra Dr
- 4149 Alva Ln
- 4088 Liberton Way
- 4082 Liberton Way
- 413 Marlowe Ct
- 2138 Kirkwall Dr
- 3108 Celt Alley
- 620 Westcott Ln
- 4806 Kintore Dr
- 4811 Kintore Dr
- 4807 Kintore Dr
- 1341 Duns Ln
- 4805 Kintore Dr
- 625 Westcott Ln
- 301 Whitman Ct
- 2126 Kirkwall Dr
- 5012 Wick Ln
- 4701 Perth Ln
- 8280 Middlewick Ln
- 8276 Middlewick Ln
- 8288 Middlewick Ln
- 8272 Middlewick Ln
- 8281 Middlewick Ln
- 8277 Middlewick Ln
- 8273 Middlewick Ln
- 8273 Middlewick Ln
- 2200 Kirkwall Dr
- 8269 Middlewick Ln
- 8264 Middlewick Ln
- 2200 Kirkwall Dr
- 2181 Kirkwall Dr
- 2182 Kirkwall Dr
- 8265 Middlewick Ln
- 8266 Middlewick Ln
- 8260 Middlewick Ln
- 9169 Macauley Ln
- 512 Wilcox Ct
- 2178 Kirkwall Dr