Estimated Value: $558,000 - $686,000
5
Beds
4
Baths
3,269
Sq Ft
$190/Sq Ft
Est. Value
About This Home
This home is located at 82859 Mount Riley Dr, Indio, CA 92203 and is currently estimated at $622,074, approximately $190 per square foot. 82859 Mount Riley Dr is a home located in Riverside County with nearby schools including Richard R. Oliphant Elementary, Desert Ridge Academy, and Shadow Hills High School.
Ownership History
Date
Name
Owned For
Owner Type
Purchase Details
Closed on
Sep 16, 2020
Sold by
Leal Brenda D and Esguerra Daisy Marie
Bought by
Esguerra Daisy Marie
Current Estimated Value
Home Financials for this Owner
Home Financials are based on the most recent Mortgage that was taken out on this home.
Original Mortgage
$241,570
Outstanding Balance
$193,198
Interest Rate
2.8%
Mortgage Type
New Conventional
Estimated Equity
$428,876
Purchase Details
Closed on
Dec 19, 2017
Sold by
Leal Brenda
Bought by
Leal Brenda D and Esguerra Daisy Marie
Purchase Details
Closed on
Sep 10, 2008
Sold by
Western Pacific Housing Inc
Bought by
Leal Brenda
Home Financials for this Owner
Home Financials are based on the most recent Mortgage that was taken out on this home.
Original Mortgage
$264,266
Interest Rate
5.03%
Mortgage Type
FHA
Create a Home Valuation Report for This Property
The Home Valuation Report is an in-depth analysis detailing your home's value as well as a comparison with similar homes in the area
Home Values in the Area
Average Home Value in this Area
Purchase History
| Date | Buyer | Sale Price | Title Company |
|---|---|---|---|
| Esguerra Daisy Marie | -- | First American Title Co | |
| Leal Brenda D | -- | None Available | |
| Leal Brenda | $269,500 | Fidelity National Title-Majo |
Source: Public Records
Mortgage History
| Date | Status | Borrower | Loan Amount |
|---|---|---|---|
| Open | Esguerra Daisy Marie | $241,570 | |
| Previous Owner | Leal Brenda | $264,266 |
Source: Public Records
Tax History Compared to Growth
Tax History
| Year | Tax Paid | Tax Assessment Tax Assessment Total Assessment is a certain percentage of the fair market value that is determined by local assessors to be the total taxable value of land and additions on the property. | Land | Improvement |
|---|---|---|---|---|
| 2025 | $8,954 | $426,475 | $81,181 | $345,294 |
| 2023 | $8,954 | $409,917 | $78,030 | $331,887 |
| 2022 | $8,702 | $401,880 | $76,500 | $325,380 |
| 2021 | $8,415 | $394,000 | $75,000 | $319,000 |
| 2020 | $7,096 | $316,898 | $63,576 | $253,322 |
| 2019 | $6,983 | $310,685 | $62,330 | $248,355 |
| 2018 | $6,872 | $304,594 | $61,109 | $243,485 |
| 2017 | $6,796 | $298,622 | $59,911 | $238,711 |
| 2016 | $6,713 | $292,768 | $58,737 | $234,031 |
| 2015 | $6,678 | $288,371 | $57,855 | $230,516 |
| 2014 | $6,408 | $268,000 | $54,000 | $214,000 |
Source: Public Records
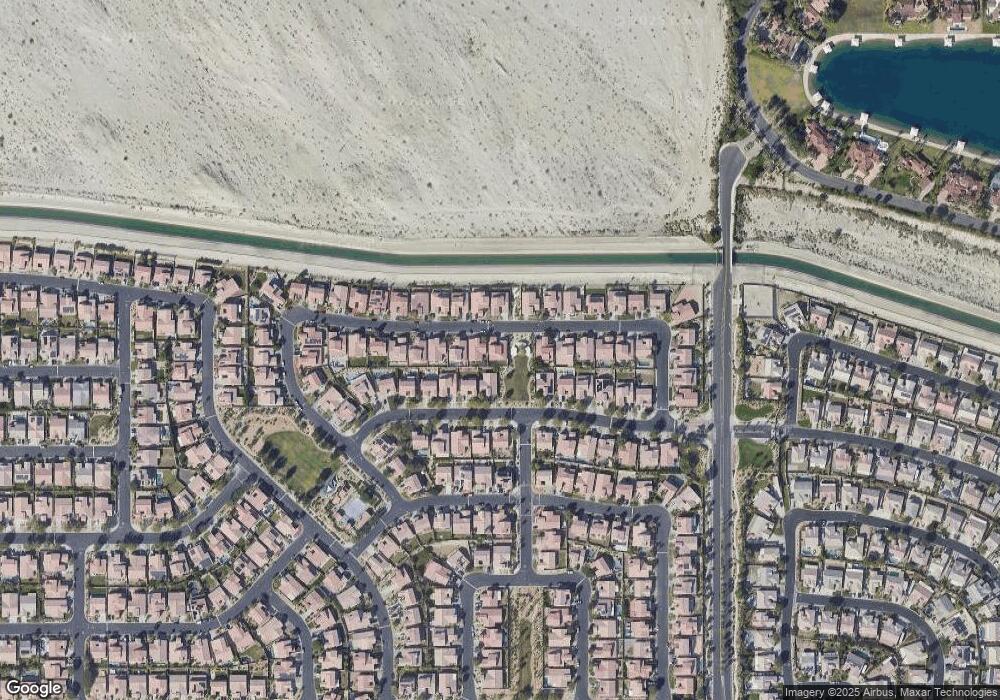
Map
Nearby Homes
- 82838 Angels Camp Dr
- 82837 Angels Camp Dr
- 40714 Ophir Canyon St
- 83065 Carmel Mountain Dr
- 82572 Tremetina Ct
- 82607 Castleton Dr
- 41069 Bear Creek St
- 83015 N Shore Dr Unit 11
- 82577 Belfort Ct
- 83094 Prairie Dunes Way
- 40567 Broadmoor Dr
- 83287 Long Cove Dr
- 41371 Edwards Ct
- 83281 Brighton Crest Dr
- 82781 Larsen Dr
- 83145 N Shore Dr
- 82622 Tivoli Ct
- 82602 Tivoli Ct
- 82283 Sardinia Rd
- 83293 Fairbanks Ave
- 82847 Mount Riley Dr
- 82 Mount Riley Dr
- 82852 Rustic Valley Dr
- 82833 Mount Riley Dr
- 82840 Rustic Valley 1liqwotdzytj
- 82858 Mount Riley Dr
- 82891 Mount Riley Dr
- 82844 Mount Riley Dr
- 82882 Mount Riley Dr
- 82886 Rustic Valley Dr
- 82832 Mount Riley Dr
- 82821 Mount Riley Dr
- 82828 Rustic Valley Dr
- 82901 Mount Riley Dr
- 82892 Mount Riley Dr
- 82900 Rustic Valley Dr
- 82816 Rustic Valley Dr
- 82809 Mount Riley Dr
- 82913 Mount Riley Dr
- 82806 Mount Riley Dr