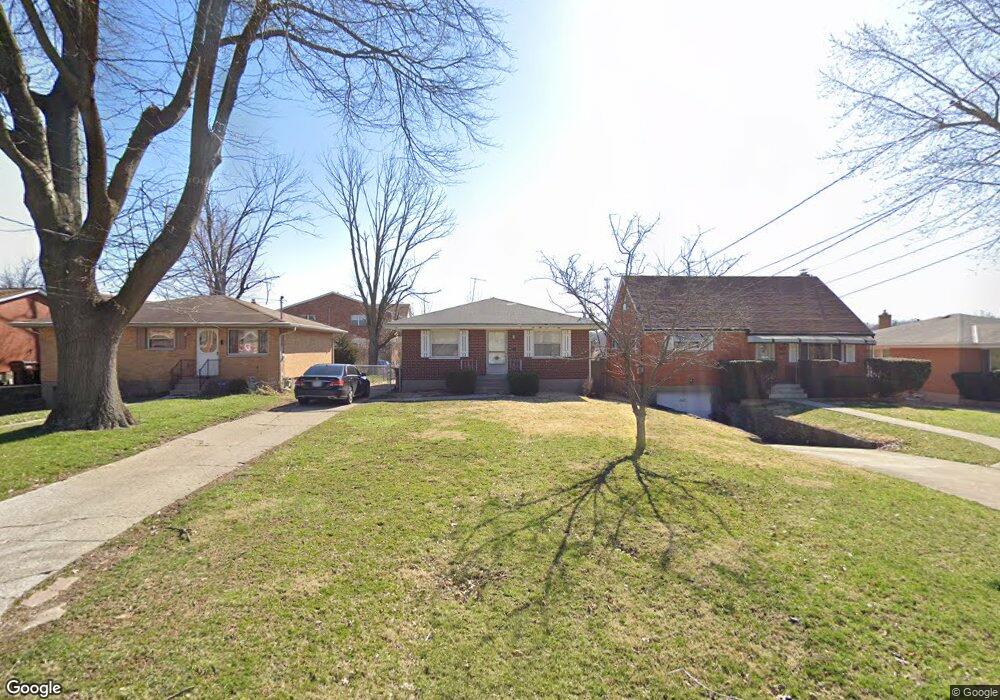
8288 Bobolink Ave Cincinnati, OH 45231
Estimated Value: $187,000 - $232,000
3
Beds
2
Baths
1,160
Sq Ft
$176/Sq Ft
Est. Value
About This Home
This home is located at 8288 Bobolink Ave, Cincinnati, OH 45231 and is currently estimated at $204,196, approximately $176 per square foot. 8288 Bobolink Ave is a home located in Hamilton County with nearby schools including North College Hill Elementary School, North College Hill Middle School, and North College Hill High School.
Ownership History
Date
Name
Owned For
Owner Type
Purchase Details
Closed on
Sep 25, 2019
Sold by
Neighborhood Enrichment Llc
Bought by
Conrex Ml Sma 2019 01 Operating Co Llc
Current Estimated Value
Purchase Details
Closed on
Sep 11, 2019
Sold by
Craftsman Properties Llc
Bought by
Neighborhood Enrichment Llc
Purchase Details
Closed on
Aug 23, 2019
Sold by
Johnson Warner Angela
Bought by
Craftsman Properties Llc
Purchase Details
Closed on
Jan 10, 2017
Sold by
Warner Timothy R
Bought by
Johnson-Warner Angela
Purchase Details
Closed on
May 24, 2003
Sold by
Johnson Angela
Bought by
Warner Timothy R and Johnson Angela
Home Financials for this Owner
Home Financials are based on the most recent Mortgage that was taken out on this home.
Original Mortgage
$97,200
Interest Rate
10%
Mortgage Type
New Conventional
Purchase Details
Closed on
Jul 26, 1999
Sold by
Wabnitz Cindy M and Wabnitz Cindy M
Bought by
Johnson Angela D
Home Financials for this Owner
Home Financials are based on the most recent Mortgage that was taken out on this home.
Original Mortgage
$87,200
Interest Rate
9.5%
Mortgage Type
Unknown
Create a Home Valuation Report for This Property
The Home Valuation Report is an in-depth analysis detailing your home's value as well as a comparison with similar homes in the area
Home Values in the Area
Average Home Value in this Area
Purchase History
| Date | Buyer | Sale Price | Title Company |
|---|---|---|---|
| Conrex Ml Sma 2019 01 Operating Co Llc | $60,000 | None Available | |
| Neighborhood Enrichment Llc | $60,000 | None Available | |
| Craftsman Properties Llc | $47,000 | None Available | |
| Johnson-Warner Angela | -- | -- | |
| Warner Timothy R | -- | -- | |
| Johnson Angela D | $89,900 | -- |
Source: Public Records
Mortgage History
| Date | Status | Borrower | Loan Amount |
|---|---|---|---|
| Previous Owner | Warner Timothy R | $97,200 | |
| Previous Owner | Johnson Angela D | $87,200 |
Source: Public Records
Tax History Compared to Growth
Tax History
| Year | Tax Paid | Tax Assessment Tax Assessment Total Assessment is a certain percentage of the fair market value that is determined by local assessors to be the total taxable value of land and additions on the property. | Land | Improvement |
|---|---|---|---|---|
| 2024 | $2,494 | $46,894 | $7,102 | $39,792 |
| 2023 | $2,473 | $46,894 | $7,102 | $39,792 |
| 2022 | $2,289 | $31,053 | $5,366 | $25,687 |
| 2021 | $2,692 | $31,053 | $5,366 | $25,687 |
| 2020 | $1,964 | $31,053 | $5,366 | $25,687 |
| 2019 | $1,936 | $27,241 | $4,708 | $22,533 |
| 2018 | $1,877 | $27,241 | $4,708 | $22,533 |
| 2017 | $1,778 | $27,241 | $4,708 | $22,533 |
| 2016 | $1,683 | $27,412 | $6,384 | $21,028 |
| 2015 | $1,685 | $27,412 | $6,384 | $21,028 |
| 2014 | $1,683 | $27,412 | $6,384 | $21,028 |
| 2013 | $1,736 | $29,159 | $6,790 | $22,369 |
Source: Public Records
Map
Nearby Homes
- 7923 Bobolink Dr
- 7929 Cherrywood Ct
- 1280 Brushwood Ave
- 8579 Daly Rd
- 8543 Foxcroft Dr
- 8681 Desoto Dr
- 6832 Tarawa Dr
- 6765 Richard Ave
- 8772 Balboa Dr
- 1025 Eastgate Dr
- 1478 Foxwood Dr
- 1544 W Galbraith Rd
- 6596 S Oak Knoll Dr
- 1029 Bluejay Dr
- 8584 Mockingbird Ln
- 6785 Marvin Ave
- 6642 Plantation Way
- 6586 S Oak Knoll Dr
- 8627 Mockingbird Ln
- 1006 Hearthstone Dr
- 8288 Bobolink Dr
- 8282 Bobolink Ave
- 8294 Bobolink Ave
- 8294 Bobolink Dr
- 8274 Bobolink Ave
- 8300 Bobolink Ave
- 8268 Bobolink Ave
- 8306 Bobolink Ave
- 8268 Bobolink Dr
- 8306 Bobolink Dr
- 8316 Bobolink Dr
- 8316 Bobolink Ave
- 8254 Bobolink Ave
- 8289 Bobolink Ave
- 8295 Bobolink Ave
- 0 Bobolink Dr
- 8301 Bobolink Dr
- 8283 Bobolink Ave
- 8301 Bobolink Ave
- 8273 Bobolink Ave