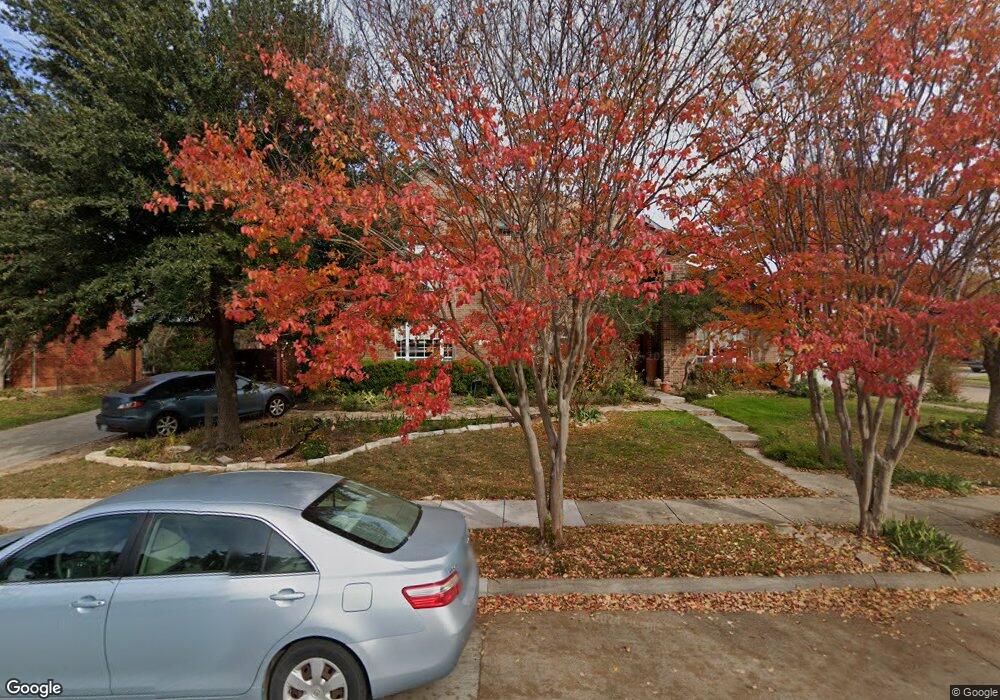
829 Abbots Ln Denton, TX 76205
South Denton NeighborhoodEstimated Value: $555,000 - $590,147
4
Beds
4
Baths
3,268
Sq Ft
$175/Sq Ft
Est. Value
About This Home
This home is located at 829 Abbots Ln, Denton, TX 76205 and is currently estimated at $572,037, approximately $175 per square foot. 829 Abbots Ln is a home located in Denton County with nearby schools including Houston Elementary School, McMath Middle School, and Denton High School.
Ownership History
Date
Name
Owned For
Owner Type
Purchase Details
Closed on
Sep 6, 2013
Sold by
Mizera Virginia M
Bought by
Currie Lisa
Current Estimated Value
Purchase Details
Closed on
Feb 15, 2005
Sold by
Currie Lisa M
Bought by
Mizera Virginia M
Home Financials for this Owner
Home Financials are based on the most recent Mortgage that was taken out on this home.
Original Mortgage
$50,000
Interest Rate
5.82%
Mortgage Type
Stand Alone First
Purchase Details
Closed on
Apr 17, 2002
Sold by
Jensen Kurt V and Jensen Kimberly D
Bought by
1111 Enterprises Ltd
Purchase Details
Closed on
Jul 1, 1998
Sold by
Pulte Homes Of Texas Lp
Bought by
Jensen Kurt and Jensen Kimberly D
Home Financials for this Owner
Home Financials are based on the most recent Mortgage that was taken out on this home.
Original Mortgage
$150,350
Interest Rate
7.08%
Create a Home Valuation Report for This Property
The Home Valuation Report is an in-depth analysis detailing your home's value as well as a comparison with similar homes in the area
Home Values in the Area
Average Home Value in this Area
Purchase History
| Date | Buyer | Sale Price | Title Company |
|---|---|---|---|
| Currie Lisa | -- | None Available | |
| Mizera Virginia M | -- | -- | |
| Currie Lisa M | -- | Reunion Title | |
| 1111 Enterprises Ltd | -- | -- | |
| 1111 Enterprises Ltd | -- | -- | |
| Jensen Kurt | -- | -- |
Source: Public Records
Mortgage History
| Date | Status | Borrower | Loan Amount |
|---|---|---|---|
| Previous Owner | Currie Lisa M | $50,000 | |
| Previous Owner | Jensen Kurt | $150,350 |
Source: Public Records
Tax History Compared to Growth
Tax History
| Year | Tax Paid | Tax Assessment Tax Assessment Total Assessment is a certain percentage of the fair market value that is determined by local assessors to be the total taxable value of land and additions on the property. | Land | Improvement |
|---|---|---|---|---|
| 2025 | $2,636 | $549,505 | $96,518 | $452,987 |
| 2024 | $10,161 | $526,420 | $0 | $0 |
| 2023 | $2,645 | $478,564 | $85,163 | $477,812 |
| 2022 | $9,236 | $435,058 | $85,163 | $357,386 |
| 2021 | $8,792 | $404,703 | $85,163 | $319,540 |
| 2020 | $8,218 | $359,552 | $85,163 | $274,389 |
| 2019 | $8,400 | $352,058 | $85,163 | $266,895 |
| 2018 | $7,988 | $330,673 | $67,163 | $288,328 |
| 2017 | $7,430 | $300,612 | $53,730 | $249,307 |
| 2016 | $4,670 | $273,284 | $53,730 | $219,554 |
| 2015 | $4,329 | $249,777 | $46,152 | $203,625 |
| 2014 | $4,329 | $227,137 | $46,152 | $191,368 |
| 2013 | -- | $206,488 | $46,152 | $160,336 |
Source: Public Records
Map
Nearby Homes
- 816 Chapel Dr
- 824 Sandpiper Dr
- 821 Sandpiper Dr
- 829 Skylark Dr
- 1000 Lynhurst Ln
- 2226 Savannah Trail
- 1012 Indian Ridge Dr
- 2216 Jefferson Trail
- 1108 Ellison Park Cir
- 916 Smokerise Cir
- 720 Smokerise Cir
- 39 Highview Cir
- 3109 Forrestridge Dr
- 2120 Fairfax Rd
- 924 Ridgecrest Cir
- 2012 Hollyhill Ln
- 2000 Lamprey Cir
- 2009 Lake Fork Ct
- 2253 Hollyhill Ln
- 2100 Fairfax Rd
- 825 Abbots Ln
- 903 Providence St
- 900 Providence St
- 832 Abbots Ln
- 821 Abbots Ln
- 828 Abbots Ln
- 836 Abbots Ln
- 905 Providence St
- 904 Providence St
- 900 Abbots Ln
- 824 Abbots Ln
- 808 Chapel Dr
- 812 Chapel Dr
- 804 Chapel Dr
- 909 Providence St
- 908 Providence St
- 905 Abbots Ln
- 800 Chapel Dr
- 904 Abbots Ln
- 820 Abbots Ln