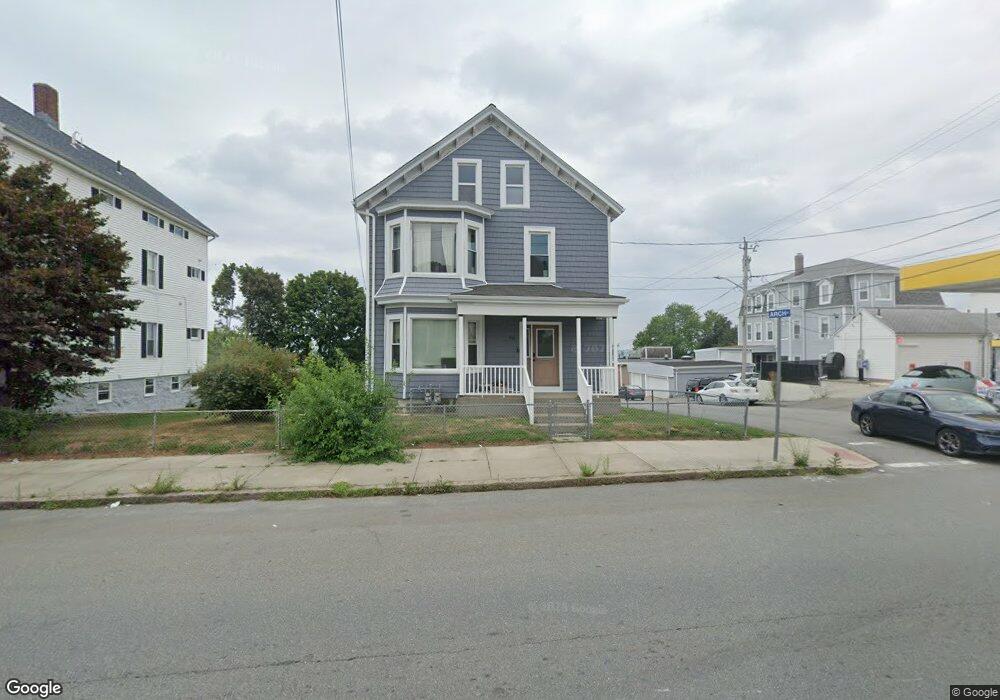
829 Broadway Unit 2 Fall River, MA 02724
Sandy Beach NeighborhoodEstimated Value: $437,687 - $632,000
2
Beds
1
Bath
975
Sq Ft
$535/Sq Ft
Est. Value
About This Home
This home is located at 829 Broadway Unit 2, Fall River, MA 02724 and is currently estimated at $521,172, approximately $534 per square foot. 829 Broadway Unit 2 is a home located in Bristol County with nearby schools including Carlton M. Viveiros Elementary School, Matthew J. Kuss Middle School, and B M C Durfee High School.
Ownership History
Date
Name
Owned For
Owner Type
Purchase Details
Closed on
Apr 3, 2021
Sold by
Byington H Douglas
Bought by
Byington Jane and Byington Deborah
Current Estimated Value
Purchase Details
Closed on
Jul 23, 2007
Sold by
Bradbury Ft
Bought by
Byington Deborah A and Douglas Byington H
Purchase Details
Closed on
Aug 28, 2006
Sold by
Byington H Douglas
Bought by
Byington Deborah A and Byington Jane E
Create a Home Valuation Report for This Property
The Home Valuation Report is an in-depth analysis detailing your home's value as well as a comparison with similar homes in the area
Home Values in the Area
Average Home Value in this Area
Purchase History
| Date | Buyer | Sale Price | Title Company |
|---|---|---|---|
| Byington Jane | -- | None Available | |
| Byington Deborah A | $116,857 | -- | |
| Byington H Douglas | -- | -- | |
| Byington Deborah A | -- | -- |
Source: Public Records
Tax History
| Year | Tax Paid | Tax Assessment Tax Assessment Total Assessment is a certain percentage of the fair market value that is determined by local assessors to be the total taxable value of land and additions on the property. | Land | Improvement |
|---|---|---|---|---|
| 2025 | $4,190 | $365,900 | $111,200 | $254,700 |
| 2024 | $3,858 | $335,800 | $107,100 | $228,700 |
| 2023 | $3,499 | $285,200 | $88,500 | $196,700 |
| 2022 | $3,265 | $258,700 | $84,300 | $174,400 |
| 2021 | $3,058 | $221,100 | $80,200 | $140,900 |
| 2020 | $2,792 | $193,200 | $79,000 | $114,200 |
| 2019 | $2,659 | $182,400 | $76,100 | $106,300 |
| 2018 | $2,639 | $180,500 | $82,400 | $98,100 |
| 2017 | $2,402 | $171,600 | $78,500 | $93,100 |
| 2016 | $2,380 | $174,600 | $83,600 | $91,000 |
| 2015 | $2,284 | $174,600 | $83,600 | $91,000 |
| 2014 | $2,258 | $179,500 | $81,100 | $98,400 |
Source: Public Records
Map
Nearby Homes
- 1273-1279 S Main St
- 1334 S Main St
- 70 Brown St
- 71 Mystic St Unit 3
- 82 Montaup St
- 20 Wilcox St
- 219 Montaup St
- 344-354 E Main St
- 240 Montaup St
- 355 Peckham St
- 150 Forest St
- 420 Bradford Ave
- 917 Dwelly St
- 303 Eagle St Unit C
- 111 Park St
- 105 Park St
- 234 Kilburn St
- 334 Fountain St
- 403 Division St Unit 13
- 403 Division St Unit 5
Your Personal Tour Guide
Ask me questions while you tour the home.