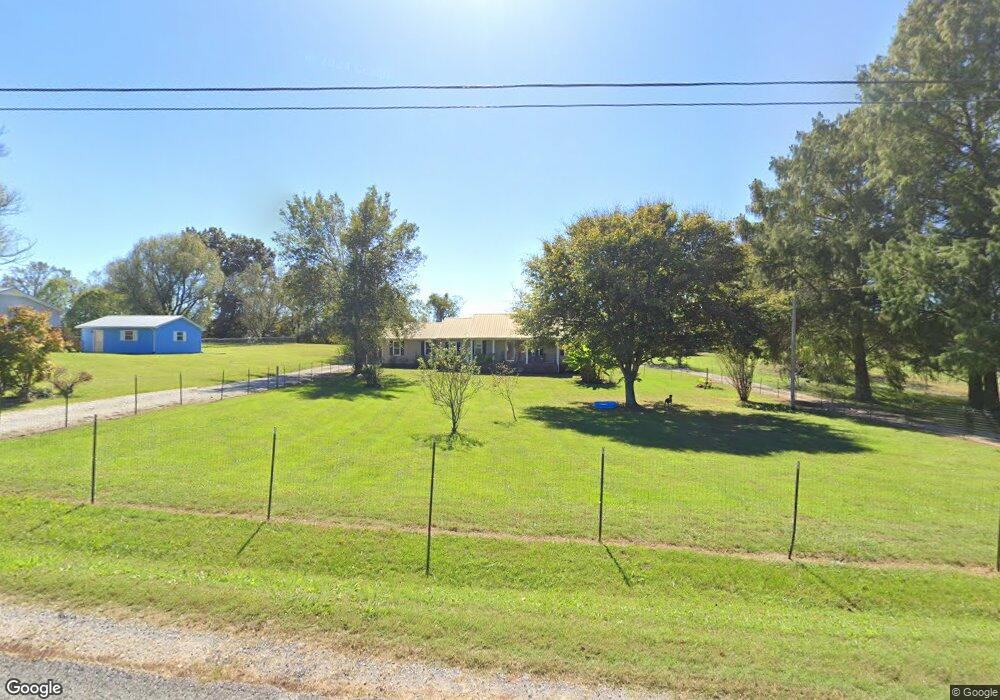
829 Cindy Dr Cookeville, TN 38506
Estimated Value: $265,691 - $291,000
--
Bed
2
Baths
1,344
Sq Ft
$209/Sq Ft
Est. Value
About This Home
This home is located at 829 Cindy Dr, Cookeville, TN 38506 and is currently estimated at $280,423, approximately $208 per square foot. 829 Cindy Dr is a home located in Putnam County with nearby schools including Cookeville High School, Algood Middle School, and Northeast Elementary School.
Ownership History
Date
Name
Owned For
Owner Type
Purchase Details
Closed on
May 8, 2013
Sold by
Loftis James Roy
Bought by
Bilbrey Marilisa S and Bilbrey Gene
Current Estimated Value
Purchase Details
Closed on
Dec 22, 2003
Sold by
Loftis Mark E and Loftis Teryl
Bought by
Roy Loftis James
Purchase Details
Closed on
Mar 28, 1988
Bought by
Loftis Mark E Teryl
Purchase Details
Closed on
Jun 16, 1987
Bought by
Jennings Bob and Jennings Marilyn
Purchase Details
Closed on
Mar 11, 1986
Bought by
Ray Robert L and Ray Barbara A
Create a Home Valuation Report for This Property
The Home Valuation Report is an in-depth analysis detailing your home's value as well as a comparison with similar homes in the area
Home Values in the Area
Average Home Value in this Area
Purchase History
| Date | Buyer | Sale Price | Title Company |
|---|---|---|---|
| Bilbrey Marilisa S | $125,000 | -- | |
| Roy Loftis James | $18,000 | -- | |
| Loftis Mark E Teryl | $52,000 | -- | |
| Jennings Bob | $4,400 | -- | |
| Ray Robert L | -- | -- |
Source: Public Records
Tax History Compared to Growth
Tax History
| Year | Tax Paid | Tax Assessment Tax Assessment Total Assessment is a certain percentage of the fair market value that is determined by local assessors to be the total taxable value of land and additions on the property. | Land | Improvement |
|---|---|---|---|---|
| 2024 | $986 | $37,075 | $3,925 | $33,150 |
| 2023 | $986 | $37,075 | $3,925 | $33,150 |
| 2022 | $916 | $37,075 | $3,925 | $33,150 |
| 2021 | $916 | $37,075 | $3,925 | $33,150 |
| 2020 | $818 | $37,075 | $3,925 | $33,150 |
| 2019 | $818 | $27,950 | $3,925 | $24,025 |
| 2018 | $763 | $27,950 | $3,925 | $24,025 |
| 2017 | $763 | $27,950 | $3,925 | $24,025 |
| 2016 | $727 | $27,950 | $3,925 | $24,025 |
| 2015 | $770 | $27,450 | $4,750 | $22,700 |
| 2014 | $759 | $27,043 | $0 | $0 |
Source: Public Records
Map
Nearby Homes