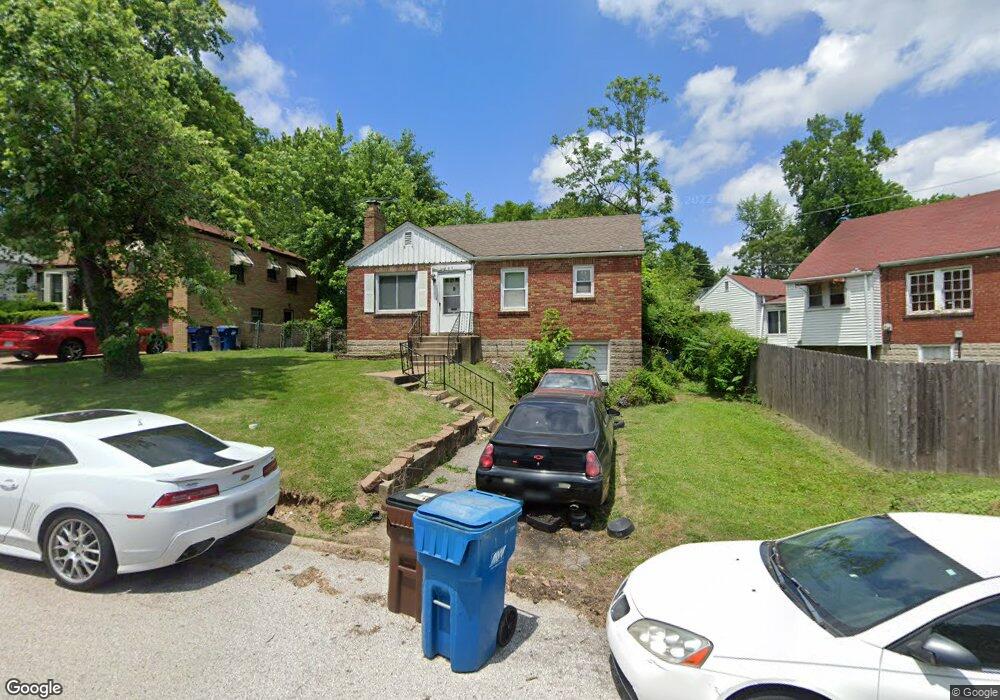
829 Margo Ave Saint Louis, MO 63135
Estimated Value: $75,000 - $94,000
2
Beds
1
Bath
816
Sq Ft
$103/Sq Ft
Est. Value
About This Home
This home is located at 829 Margo Ave, Saint Louis, MO 63135 and is currently estimated at $84,398, approximately $103 per square foot. 829 Margo Ave is a home located in St. Louis County with nearby schools including Central Elementary School, Ferguson Middle School, and McCluer High School.
Ownership History
Date
Name
Owned For
Owner Type
Purchase Details
Closed on
Nov 12, 2003
Sold by
Haakenson Scott J and Haakenson Beth M
Bought by
Bass Karod
Current Estimated Value
Home Financials for this Owner
Home Financials are based on the most recent Mortgage that was taken out on this home.
Original Mortgage
$55,920
Outstanding Balance
$31,147
Interest Rate
9%
Mortgage Type
Purchase Money Mortgage
Estimated Equity
$53,251
Purchase Details
Closed on
Dec 23, 1999
Sold by
Conway Frances L
Bought by
Haakenson Scott J and Haakenson Beth M
Home Financials for this Owner
Home Financials are based on the most recent Mortgage that was taken out on this home.
Original Mortgage
$27,300
Interest Rate
7.69%
Create a Home Valuation Report for This Property
The Home Valuation Report is an in-depth analysis detailing your home's value as well as a comparison with similar homes in the area
Home Values in the Area
Average Home Value in this Area
Purchase History
| Date | Buyer | Sale Price | Title Company |
|---|---|---|---|
| Bass Karod | $69,900 | -- | |
| Haakenson Scott J | $27,300 | -- |
Source: Public Records
Mortgage History
| Date | Status | Borrower | Loan Amount |
|---|---|---|---|
| Open | Bass Karod | $55,920 | |
| Previous Owner | Haakenson Scott J | $27,300 | |
| Closed | Bass Karod | $13,980 |
Source: Public Records
Tax History Compared to Growth
Tax History
| Year | Tax Paid | Tax Assessment Tax Assessment Total Assessment is a certain percentage of the fair market value that is determined by local assessors to be the total taxable value of land and additions on the property. | Land | Improvement |
|---|---|---|---|---|
| 2025 | $759 | $11,910 | $1,060 | $10,850 |
| 2024 | $759 | $10,250 | $1,430 | $8,820 |
| 2023 | $754 | $10,250 | $1,430 | $8,820 |
| 2022 | $643 | $7,560 | $1,060 | $6,500 |
| 2021 | $622 | $7,560 | $1,060 | $6,500 |
| 2020 | $708 | $7,770 | $1,100 | $6,670 |
| 2019 | $695 | $7,770 | $1,100 | $6,670 |
| 2018 | $570 | $5,640 | $1,120 | $4,520 |
| 2017 | $559 | $5,640 | $1,120 | $4,520 |
| 2016 | $724 | $7,270 | $1,460 | $5,810 |
| 2015 | $729 | $7,270 | $1,460 | $5,810 |
| 2014 | $870 | $8,640 | $1,440 | $7,200 |
Source: Public Records
Map
Nearby Homes
- 116 Henquin Dr
- 810 Airport Rd
- 117 Henquin Dr
- 53 N Dade Ave
- 806 Rolwes Ave
- 213 Henquin Dr
- 6130 Wulff Dr
- 138 N Marguerite Ave
- 6016 Shillington Dr
- 218 N Marguerite Ave
- 6005 Shillington Dr
- 324 Newell Dr
- 28 N Harvey Ave
- 8042 Patterson Dr
- 415 Warford Ave
- 8027 Aline Ave
- 439 Warford Ave
- 614 January Ave
- 720 Tiffin Ave
- 415 Wesley Ave