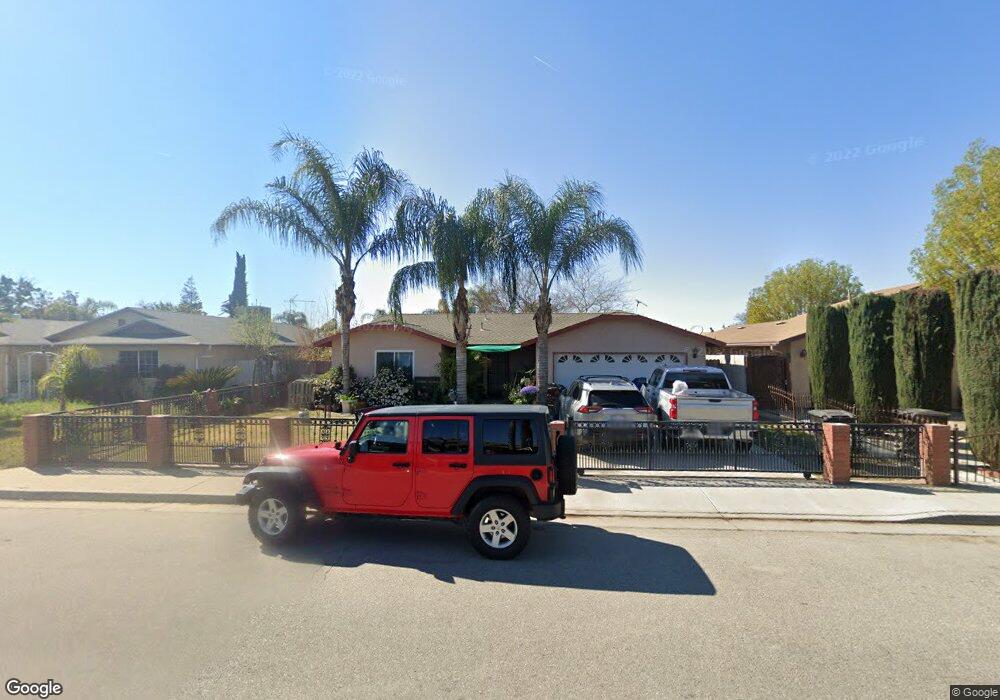
829 Oakmont St Shafter, CA 93263
Estimated Value: $219,000 - $310,000
3
Beds
2
Baths
1,117
Sq Ft
$244/Sq Ft
Est. Value
About This Home
This home is located at 829 Oakmont St, Shafter, CA 93263 and is currently estimated at $272,238, approximately $243 per square foot. 829 Oakmont St is a home located in Kern County with nearby schools including Golden Oak Elementary School, Shafter High School, and Grow Academy Shafter.
Ownership History
Date
Name
Owned For
Owner Type
Purchase Details
Closed on
May 20, 2020
Sold by
Gonzalez Gerardo Z and Gonzalez Maribel G
Bought by
Zuniga Gerardo Gonzalez and Gonzalez Maribel G
Current Estimated Value
Purchase Details
Closed on
Feb 21, 2011
Sold by
Wells Fargo Bank National Association
Bought by
Gonzalez Gerardo Z and Gonzalez Maribel G
Purchase Details
Closed on
Oct 19, 2010
Sold by
Juarez Jacobo
Bought by
Wells Fargo Bank National Association
Purchase Details
Closed on
Sep 8, 2006
Sold by
Montoya Jesus R
Bought by
Juarez Jacobo
Home Financials for this Owner
Home Financials are based on the most recent Mortgage that was taken out on this home.
Original Mortgage
$172,000
Interest Rate
7.9%
Mortgage Type
Balloon
Purchase Details
Closed on
Sep 20, 1995
Sold by
Montoya Silvia
Bought by
Montoya Jesus Ramon
Purchase Details
Closed on
Aug 11, 1994
Sold by
Lewis Development Inc
Bought by
Montoya Jesus R
Create a Home Valuation Report for This Property
The Home Valuation Report is an in-depth analysis detailing your home's value as well as a comparison with similar homes in the area
Home Values in the Area
Average Home Value in this Area
Purchase History
| Date | Buyer | Sale Price | Title Company |
|---|---|---|---|
| Zuniga Gerardo Gonzalez | -- | None Available | |
| Gonzalez Gerardo Z | $72,000 | Lsi Title Company Ca | |
| Wells Fargo Bank National Association | $85,000 | Accommodation | |
| Juarez Jacobo | $215,000 | First American Title Company | |
| Montoya Jesus Ramon | -- | First American Title Ins Co | |
| Montoya Jesus R | $69,000 | First American Title Ins Co |
Source: Public Records
Mortgage History
| Date | Status | Borrower | Loan Amount |
|---|---|---|---|
| Previous Owner | Juarez Jacobo | $172,000 |
Source: Public Records
Tax History
| Year | Tax Paid | Tax Assessment Tax Assessment Total Assessment is a certain percentage of the fair market value that is determined by local assessors to be the total taxable value of land and additions on the property. | Land | Improvement |
|---|---|---|---|---|
| 2025 | $1,336 | $92,231 | $25,617 | $66,614 |
| 2024 | $1,294 | $90,423 | $25,115 | $65,308 |
| 2023 | $1,294 | $88,651 | $24,623 | $64,028 |
| 2022 | $1,235 | $86,914 | $24,141 | $62,773 |
| 2021 | $1,174 | $85,211 | $23,668 | $61,543 |
| 2020 | $1,134 | $84,338 | $23,426 | $60,912 |
| 2019 | $1,132 | $84,338 | $23,426 | $60,912 |
| 2018 | $1,091 | $81,065 | $22,517 | $58,548 |
| 2017 | $1,084 | $79,476 | $22,076 | $57,400 |
| 2016 | $1,026 | $77,919 | $21,644 | $56,275 |
| 2015 | $995 | $76,749 | $21,319 | $55,430 |
| 2014 | $958 | $75,247 | $20,902 | $54,345 |
Source: Public Records
Map
Nearby Homes
- 849 Brittany St
- 3106 Lone Cedar Way
- 3118 Lone Cedar Way
- 111 Planada Dr
- 9211 Woodbrook Dr
- 700 S Shafter Ave Unit 115
- 137 W Ash Ave
- 355 S Wall St
- 408 W Euclid Ave
- 187 E Orange Ave
- 285 E Ash Ave
- 245 Atlantic Ave
- 3712 Blazing Way
- 3719 Bird Ct
- 8413 Bareback Ave
- 249 E Marengo Ave
- 760 Brookside Dr
- 391 E Euclid Ave
- 9304 Parkdale Way
- 9329 Willow Terrace Dr
- 835 Oakmont St
- 823 Oakmont St Unit 1
- 830 Verde St Unit 1
- 834 Verde St
- 824 Verde St
- 841 Oakmont St Unit 2
- 840 Verde St
- 830 Oakmont St Unit 1
- 836 Oakmont St
- 824 Oakmont St Unit 1
- 847 Oakmont St
- 842 Oakmont St
- 846 Verde St
- 352 Fair Haven Ave
- 366 Fair Haven Ave Unit 1
- 384 Fair Haven Ave Unit 1
- 853 Oakmont St
- 848 Oakmont St Unit 2
- 342 Fair Haven Ave Unit 1
- 829 Verde St Unit 1
Your Personal Tour Guide
Ask me questions while you tour the home.