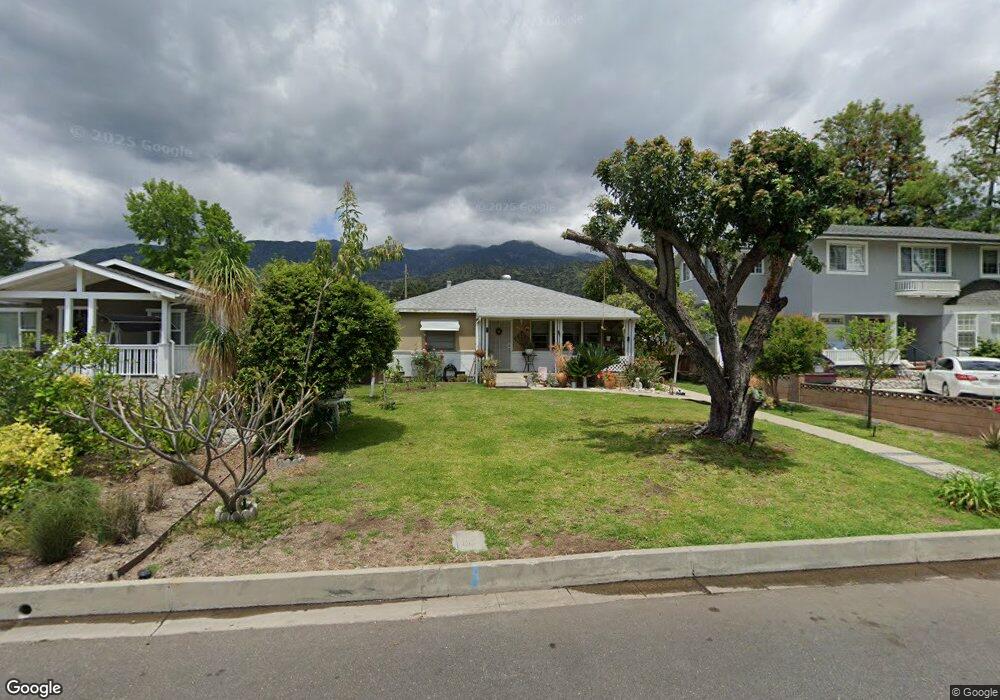
829 Ocean View Ave Monrovia, CA 91016
Estimated Value: $1,049,724 - $1,071,000
4
Beds
2
Baths
1,528
Sq Ft
$693/Sq Ft
Est. Value
About This Home
This home is located at 829 Ocean View Ave, Monrovia, CA 91016 and is currently estimated at $1,058,681, approximately $692 per square foot. 829 Ocean View Ave is a home located in Los Angeles County with nearby schools including Bradoaks Elementary Science Academy, Clifton Middle School, and Monrovia High School.
Ownership History
Date
Name
Owned For
Owner Type
Purchase Details
Closed on
Jun 20, 2015
Sold by
Martinez Gabriel
Bought by
Martinez Gloria
Current Estimated Value
Home Financials for this Owner
Home Financials are based on the most recent Mortgage that was taken out on this home.
Original Mortgage
$323,846
Outstanding Balance
$251,363
Interest Rate
3.81%
Mortgage Type
New Conventional
Estimated Equity
$807,318
Purchase Details
Closed on
Nov 21, 2005
Sold by
Torres Juan M and Torres Maria Martha
Bought by
Torres Juan M and Torres Maria Martha
Home Financials for this Owner
Home Financials are based on the most recent Mortgage that was taken out on this home.
Original Mortgage
$375,000
Interest Rate
6.07%
Mortgage Type
New Conventional
Purchase Details
Closed on
Jan 11, 2002
Sold by
Torres Juan M and Torres Maria Martha
Bought by
Torres Juan M and Torres Maria Martha
Purchase Details
Closed on
Jan 23, 1999
Sold by
Gomez Rocio
Bought by
Torres Juan M and Torres Maria Martha
Create a Home Valuation Report for This Property
The Home Valuation Report is an in-depth analysis detailing your home's value as well as a comparison with similar homes in the area
Home Values in the Area
Average Home Value in this Area
Purchase History
| Date | Buyer | Sale Price | Title Company |
|---|---|---|---|
| Martinez Gloria | -- | Wfg Lender Services | |
| Torres Juan M | -- | Wfg Lender Services | |
| Torres Gustavo | -- | Wfg Lender Services | |
| Torres Juan M | -- | Fidelity National Title Comp | |
| Torres Juan M | -- | New Century Title Company | |
| Torres Juan M | -- | -- |
Source: Public Records
Mortgage History
| Date | Status | Borrower | Loan Amount |
|---|---|---|---|
| Open | Torres Gustavo | $323,846 | |
| Closed | Torres Juan M | $375,000 |
Source: Public Records
Tax History
| Year | Tax Paid | Tax Assessment Tax Assessment Total Assessment is a certain percentage of the fair market value that is determined by local assessors to be the total taxable value of land and additions on the property. | Land | Improvement |
|---|---|---|---|---|
| 2025 | $5,444 | $376,870 | $196,737 | $180,133 |
| 2024 | $5,444 | $369,481 | $192,880 | $176,601 |
| 2023 | $5,324 | $362,238 | $189,099 | $173,139 |
| 2022 | $5,175 | $355,137 | $185,392 | $169,745 |
| 2021 | $5,072 | $348,174 | $181,757 | $166,417 |
| 2020 | $4,928 | $344,605 | $179,894 | $164,711 |
| 2019 | $4,845 | $337,849 | $176,367 | $161,482 |
| 2018 | $4,668 | $331,225 | $172,909 | $158,316 |
| 2016 | $4,485 | $318,365 | $166,196 | $152,169 |
| 2015 | $4,389 | $313,584 | $163,700 | $149,884 |
| 2014 | $4,355 | $307,442 | $160,494 | $146,948 |
Source: Public Records
Map
Nearby Homes
- 115 N Mountain Ave Unit A
- 824 Ocean View Ave
- 835 E Foothill Blvd
- 930 Ocean View Ave Unit E
- 136 Madeline Dr
- 108 S Mountain Ave Unit A
- 248 Poppy Ave
- 61 Palm Hill Ln
- 408 Meadow Ln
- 100 Palm Hill Ln
- 424 E Foothill Blvd
- 149 Grand Ave
- 188 Deodar Ln
- 0 Norumbega Dr
- 549 Norumbega Dr
- 201 Deodar Ln
- 257 Aspen Dr
- 520 E Lime Ave
- 785 Norumbega Dr
- 318 S Canyon Blvd
- 825 Ocean View Ave
- 833 Ocean View Ave
- 145 N Mountain Ave
- 823 Ocean View Ave
- 817 Ocean View Ave
- 153 N Mountain Ave
- 811 Ocean View Ave
- 140 N Mountain Ave
- 157 N Mountain Ave
- 826 Valley View Ave
- 146 N Mountain Ave
- 138 N Mountain Ave
- 824 Valley View Ave
- 150 N Mountain Ave
- 121 N Mountain Ave
- 115 N Mountain Ave Unit B
- 115 N Mountain Ave Unit C
- 115 N Mountain Ave Unit D
- 121 N Mountain Ave Unit B
- 828 Ocean View Ave
Your Personal Tour Guide
Ask me questions while you tour the home.