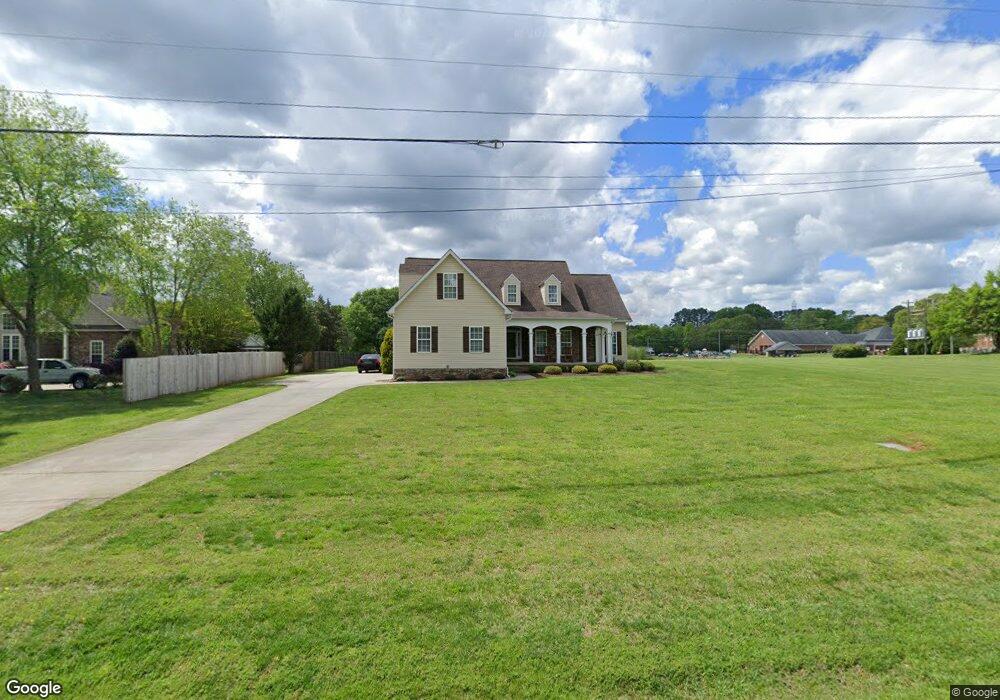
8290 Unity Church Rd Denver, NC 28037
Estimated Value: $536,712 - $719,000
3
Beds
2
Baths
2,139
Sq Ft
$291/Sq Ft
Est. Value
About This Home
This home is located at 8290 Unity Church Rd, Denver, NC 28037 and is currently estimated at $621,928, approximately $290 per square foot. 8290 Unity Church Rd is a home located in Lincoln County with nearby schools including St. James Elementary School, East Lincoln Middle School, and East Lincoln High School.
Ownership History
Date
Name
Owned For
Owner Type
Purchase Details
Closed on
Aug 28, 2014
Sold by
Mueller Adam R and Jones Teresa M
Bought by
St John Jerry W and St John Kelly A
Current Estimated Value
Home Financials for this Owner
Home Financials are based on the most recent Mortgage that was taken out on this home.
Original Mortgage
$232,750
Outstanding Balance
$178,580
Interest Rate
4.2%
Mortgage Type
New Conventional
Estimated Equity
$443,348
Purchase Details
Closed on
Dec 19, 2006
Sold by
St John Jerry W
Bought by
Mueller Adam R and Jones Teresa M
Home Financials for this Owner
Home Financials are based on the most recent Mortgage that was taken out on this home.
Original Mortgage
$212,400
Interest Rate
6.29%
Mortgage Type
New Conventional
Purchase Details
Closed on
Dec 16, 2004
Bought by
St John Jerry W
Purchase Details
Closed on
Jun 10, 2004
Bought by
Regent Builders Llc
Create a Home Valuation Report for This Property
The Home Valuation Report is an in-depth analysis detailing your home's value as well as a comparison with similar homes in the area
Home Values in the Area
Average Home Value in this Area
Purchase History
| Date | Buyer | Sale Price | Title Company |
|---|---|---|---|
| St John Jerry W | $245,000 | Stewart Title Guaranty Co | |
| Mueller Adam R | $265,500 | None Available | |
| St John Jerry W | $200,000 | -- | |
| Regent Builders Llc | $25,000 | -- |
Source: Public Records
Mortgage History
| Date | Status | Borrower | Loan Amount |
|---|---|---|---|
| Open | St John Jerry W | $232,750 | |
| Previous Owner | Mueller Adam R | $212,400 |
Source: Public Records
Tax History Compared to Growth
Tax History
| Year | Tax Paid | Tax Assessment Tax Assessment Total Assessment is a certain percentage of the fair market value that is determined by local assessors to be the total taxable value of land and additions on the property. | Land | Improvement |
|---|---|---|---|---|
| 2025 | $3,017 | $476,291 | $72,000 | $404,291 |
| 2024 | $2,984 | $476,291 | $72,000 | $404,291 |
| 2023 | $2,761 | $440,003 | $72,000 | $368,003 |
| 2022 | $2,133 | $273,122 | $50,000 | $223,122 |
| 2021 | $2,147 | $273,122 | $50,000 | $223,122 |
| 2020 | $1,904 | $273,122 | $50,000 | $223,122 |
| 2019 | $1,904 | $273,122 | $50,000 | $223,122 |
| 2018 | $1,737 | $233,666 | $46,000 | $187,666 |
| 2017 | $1,636 | $233,666 | $46,000 | $187,666 |
| 2016 | $1,629 | $233,666 | $46,000 | $187,666 |
| 2015 | $1,754 | $233,666 | $46,000 | $187,666 |
| 2014 | $1,760 | $244,481 | $51,000 | $193,481 |
Source: Public Records
Map
Nearby Homes
- 2325 Perry Rd
- 8110 Squirrel Hill Ln
- 2656 Norman Isle Dr
- 7958 Unity Church Rd
- 2494 Cherry Ln
- 8111 Rainier Dr
- 7903 Smith Pond Dr
- 8260 Graham Rd
- 2514 Smith Harbour Dr
- 1751 Knights Dr
- 2866 Backwoods Trail
- 8188 Normandy Rd
- 8518 Christalina Ln
- 1925 Cameron Heights Cir
- 1959 Rock Springs Cir
- 6873 Lakecrest Ct
- 8473 Bing Cherry Dr
- 6859 Lakecrest Ct
- 2369 Stardust Ct
- 8229 Lambert Ct
- 8296 Unity Church Rd
- 8306 Unity Church Rd
- 8312 Unity Church Rd
- 8267 Unity Church Rd
- 8309 Unity Church Rd
- 8322 Unity Church Rd
- 8255 Unity Church Rd
- 8210 Unity Church Rd
- 8210 Unity Church Rd Unit 2
- 8331 Unity Church Rd
- 8346 Unity Church Rd
- Lot 3 Pine Lake Rd
- Lot 5 Pine Lake Rd
- 8056 Pine Lake Rd
- 8349 Unity Church Rd
- 2320 Perry Rd
- 8090 Sisters Ln
- 2338 W Nicole Ln
- 8361 Unity Church Rd
- 2335 W Nicole Ln