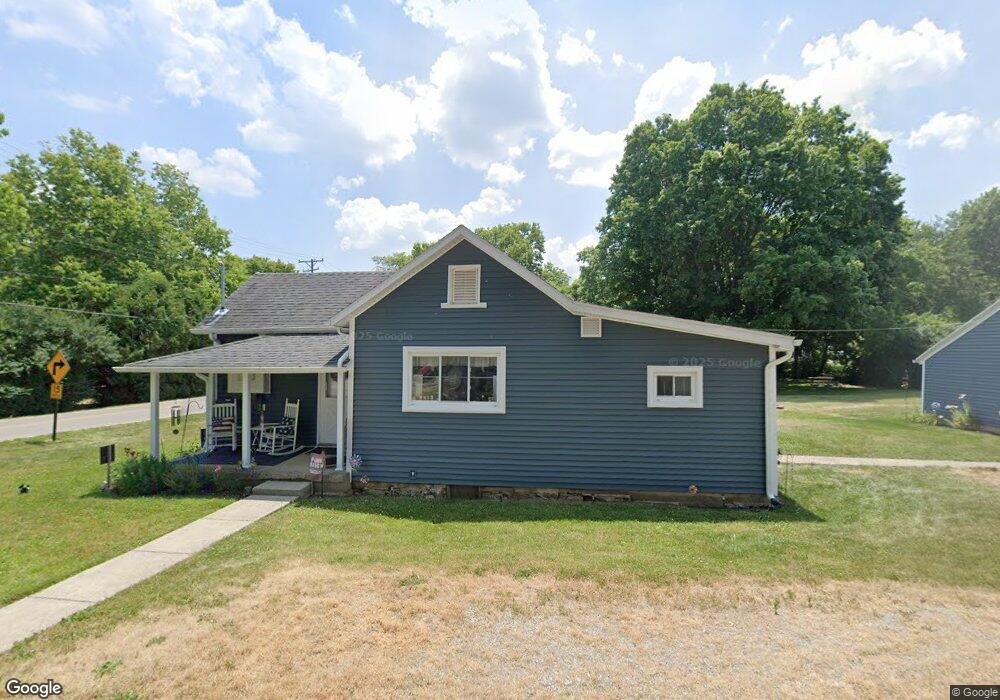
8290 W Elm St Covington, OH 45318
Estimated Value: $125,000 - $136,472
2
Beds
1
Bath
924
Sq Ft
$142/Sq Ft
Est. Value
About This Home
This home is located at 8290 W Elm St, Covington, OH 45318 and is currently estimated at $131,118, approximately $141 per square foot. 8290 W Elm St is a home located in Miami County with nearby schools including Covington Elementary/Junior High School, Covington Junior High School, and Covington High School.
Ownership History
Date
Name
Owned For
Owner Type
Purchase Details
Closed on
Mar 18, 2013
Sold by
Yount Gregory E and Yount Diane
Bought by
Yount Gregory E and Yount Diane
Current Estimated Value
Home Financials for this Owner
Home Financials are based on the most recent Mortgage that was taken out on this home.
Original Mortgage
$65,295
Outstanding Balance
$48,260
Interest Rate
4.62%
Mortgage Type
FHA
Estimated Equity
$82,858
Purchase Details
Closed on
Sep 17, 2004
Sold by
Mcardle Rosanna M
Bought by
Yount Gregory
Home Financials for this Owner
Home Financials are based on the most recent Mortgage that was taken out on this home.
Original Mortgage
$49,850
Interest Rate
6.08%
Mortgage Type
New Conventional
Purchase Details
Closed on
May 20, 2003
Sold by
Brubaker Edith M
Bought by
Mcardle Rosanna M and Edith M Brubaker Trust
Purchase Details
Closed on
Jun 12, 1991
Bought by
Baker Rose M
Create a Home Valuation Report for This Property
The Home Valuation Report is an in-depth analysis detailing your home's value as well as a comparison with similar homes in the area
Home Values in the Area
Average Home Value in this Area
Purchase History
| Date | Buyer | Sale Price | Title Company |
|---|---|---|---|
| Yount Gregory E | -- | Attorney | |
| Yount Gregory | $63,000 | -- | |
| Mcardle Rosanna M | -- | -- | |
| Baker Rose M | $41,500 | -- |
Source: Public Records
Mortgage History
| Date | Status | Borrower | Loan Amount |
|---|---|---|---|
| Open | Yount Gregory E | $65,295 | |
| Closed | Mcardle Rosanna M | $49,850 |
Source: Public Records
Tax History Compared to Growth
Tax History
| Year | Tax Paid | Tax Assessment Tax Assessment Total Assessment is a certain percentage of the fair market value that is determined by local assessors to be the total taxable value of land and additions on the property. | Land | Improvement |
|---|---|---|---|---|
| 2024 | $850 | $25,490 | $6,060 | $19,430 |
| 2023 | $850 | $25,490 | $6,060 | $19,430 |
| 2022 | $861 | $25,490 | $6,060 | $19,430 |
| 2021 | $710 | $19,610 | $4,660 | $14,950 |
| 2020 | $711 | $19,610 | $4,660 | $14,950 |
| 2019 | $709 | $19,610 | $4,660 | $14,950 |
| 2018 | $690 | $19,400 | $4,940 | $14,460 |
| 2017 | $704 | $19,400 | $4,940 | $14,460 |
| 2016 | $676 | $19,400 | $4,940 | $14,460 |
| 2015 | $641 | $18,310 | $4,660 | $13,650 |
| 2014 | $641 | $18,310 | $4,660 | $13,650 |
| 2013 | $644 | $18,310 | $4,660 | $13,650 |
Source: Public Records
Map
Nearby Homes
- 8341 W Covington Gettysburg Rd
- 221 S High St
- 536 S High St
- 202 Charles Ct
- 200 Charles Ct
- 204 Charles Ct
- 201 Charles Ct
- 206 Charles Ct
- 203 Charles Ct
- 223 Henry Ct
- 208 Charles Ct
- 205 Charles Ct
- 210 Charles Ct
- 212 Charles Ct
- 207 Charles Ct
- 221 Henry Ct
- 219 Henry Ct
- 133 W Broadway St
- 126 S Ludlow St
- 210 N Grant St
- 8330 W Elm St
- 8295 W Elm St
- 8295 W Covington Gettysburg Rd
- 5165 N Front St
- 5245 N Front St
- 5155 N Front St
- 8300 W Main St
- 8290 W Covington Gettysburg Rd
- 8330 W Main St
- 8355 W Elm St
- 8385 W Covington Gettysburg Rd
- 5160 N Front St
- 8411 W Covington Gettysburg Rd
- 5144 N Front St
- 5250 N Front St
- 8261 W Covington Gettysburg Rd
- 5277 N Front St
- 5130 N Front St
- 8385 W Elm St
- 5285 N Front St