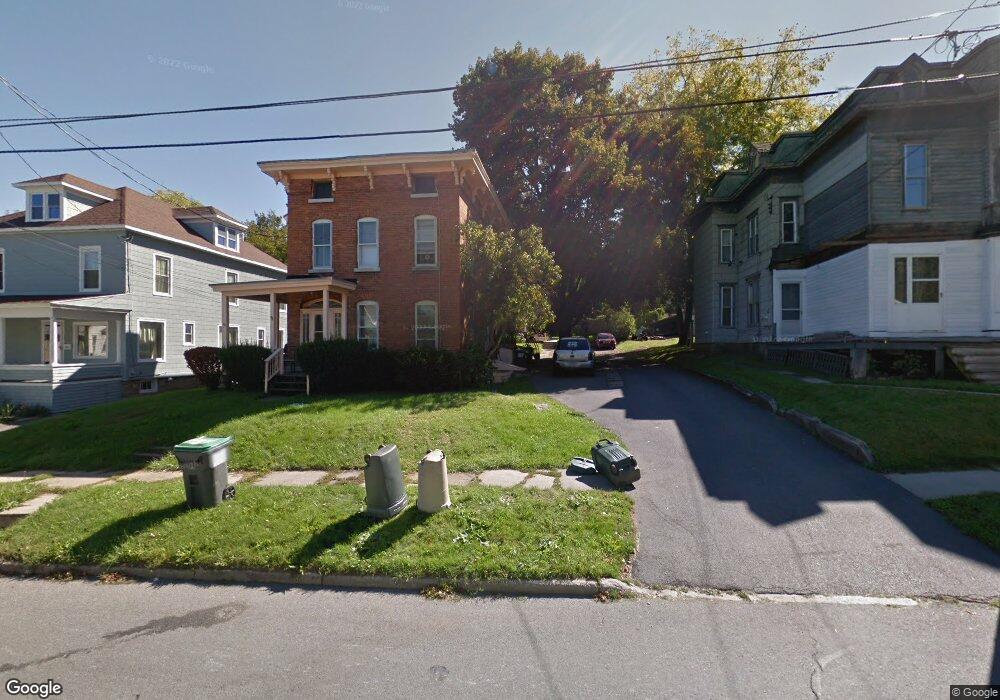
83 1/2 Moyer St Canajoharie, NY 13317
Estimated Value: $108,000 - $162,575
6
Beds
2
Baths
2,596
Sq Ft
$51/Sq Ft
Est. Value
About This Home
This home is located at 83 1/2 Moyer St, Canajoharie, NY 13317 and is currently estimated at $133,394, approximately $51 per square foot. 83 1/2 Moyer St is a home located in Montgomery County with nearby schools including East Hill School, Canajoharie Middle School, and Canajoharie Senior High School.
Ownership History
Date
Name
Owned For
Owner Type
Purchase Details
Closed on
Nov 24, 2009
Sold by
Gordon Linda
Bought by
Sackett Gabriel
Current Estimated Value
Purchase Details
Closed on
May 15, 2008
Sold by
County Of Montgomery
Bought by
Gordon Linda
Purchase Details
Closed on
Apr 8, 2008
Sold by
Montgomery County Treasurer Bowerman Shawn J
Bought by
County Of Montgomery
Purchase Details
Closed on
Feb 18, 2004
Sold by
Gordon James
Bought by
Gordon Linda
Purchase Details
Closed on
Jul 29, 1998
Sold by
Yost Kevin E and Yost Janice L
Bought by
Gordon James Linda
Create a Home Valuation Report for This Property
The Home Valuation Report is an in-depth analysis detailing your home's value as well as a comparison with similar homes in the area
Home Values in the Area
Average Home Value in this Area
Purchase History
| Date | Buyer | Sale Price | Title Company |
|---|---|---|---|
| Sackett Gabriel | $53,000 | Charles J Tallent | |
| Gordon Linda | $3,604 | None | |
| County Of Montgomery | $614 | None | |
| Gordon Linda | -- | Charles M Clark | |
| Gordon James Linda | $35,000 | -- |
Source: Public Records
Tax History Compared to Growth
Tax History
| Year | Tax Paid | Tax Assessment Tax Assessment Total Assessment is a certain percentage of the fair market value that is determined by local assessors to be the total taxable value of land and additions on the property. | Land | Improvement |
|---|---|---|---|---|
| 2024 | $3,192 | $128,400 | $13,700 | $114,700 |
| 2023 | $4,948 | $117,520 | $13,700 | $103,820 |
| 2022 | $4,375 | $104,000 | $13,700 | $90,300 |
| 2021 | $4,314 | $92,900 | $13,700 | $79,200 |
| 2020 | $3,694 | $92,900 | $13,700 | $79,200 |
| 2019 | $3,314 | $89,300 | $13,700 | $75,600 |
| 2018 | $3,314 | $89,300 | $13,700 | $75,600 |
| 2017 | $3,053 | $85,000 | $13,700 | $71,300 |
| 2016 | $3,159 | $85,000 | $13,700 | $71,300 |
| 2015 | -- | $48,000 | $4,800 | $43,200 |
| 2014 | -- | $48,000 | $4,800 | $43,200 |
Source: Public Records
Map
Nearby Homes