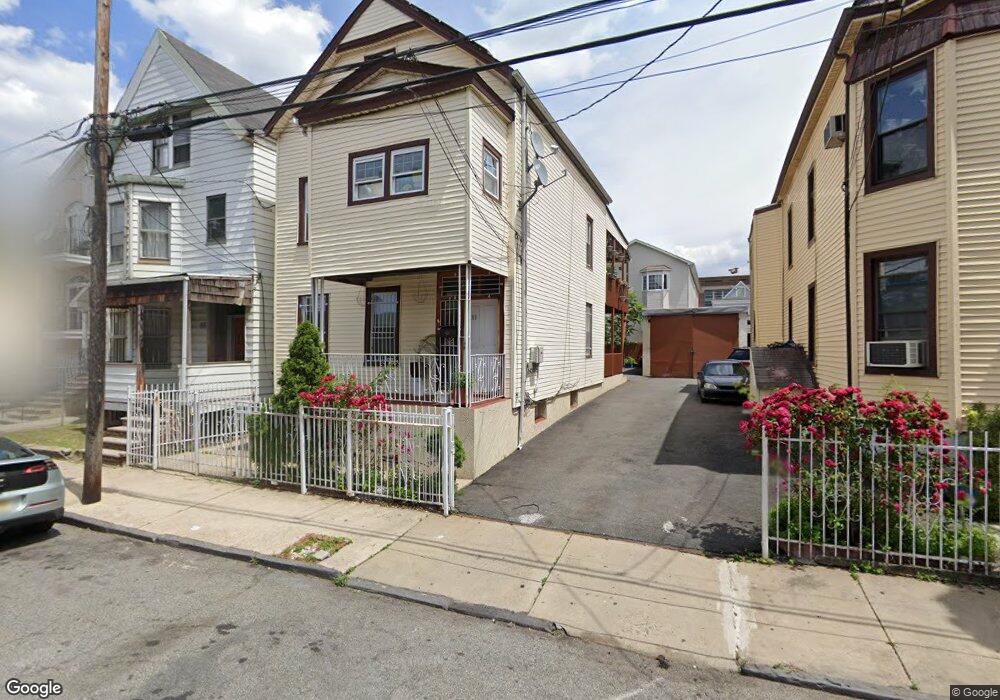
83 3rd St Newark, NJ 07107
Fairmount NeighborhoodEstimated Value: $451,250 - $612,000
Studio
--
Bath
2,096
Sq Ft
$255/Sq Ft
Est. Value
About This Home
This home is located at 83 3rd St, Newark, NJ 07107 and is currently estimated at $535,313, approximately $255 per square foot. 83 3rd St is a home located in Essex County with nearby schools including Sir Isaac Newton Elementary School, Camden Street Elementary School, and Cleveland Elementary School.
Ownership History
Date
Name
Owned For
Owner Type
Purchase Details
Closed on
Dec 14, 2001
Sold by
Rosa Francisco
Bought by
Pujols Elizabeth
Current Estimated Value
Home Financials for this Owner
Home Financials are based on the most recent Mortgage that was taken out on this home.
Original Mortgage
$117,800
Outstanding Balance
$47,770
Interest Rate
7.08%
Estimated Equity
$487,543
Purchase Details
Closed on
Jun 30, 1995
Sold by
Mullen Mary
Bought by
Rosa Francisco
Create a Home Valuation Report for This Property
The Home Valuation Report is an in-depth analysis detailing your home's value as well as a comparison with similar homes in the area
Home Values in the Area
Average Home Value in this Area
Purchase History
| Date | Buyer | Sale Price | Title Company |
|---|---|---|---|
| Pujols Elizabeth | $124,000 | -- | |
| Rosa Francisco | $15,000 | -- |
Source: Public Records
Mortgage History
| Date | Status | Borrower | Loan Amount |
|---|---|---|---|
| Open | Pujols Elizabeth | $117,800 |
Source: Public Records
Tax History
| Year | Tax Paid | Tax Assessment Tax Assessment Total Assessment is a certain percentage of the fair market value that is determined by local assessors to be the total taxable value of land and additions on the property. | Land | Improvement |
|---|---|---|---|---|
| 2025 | $4,879 | $128,300 | $20,800 | $107,500 |
| 2024 | $4,783 | $128,300 | $20,800 | $107,500 |
| 2022 | $4,793 | $128,300 | $20,800 | $107,500 |
| 2021 | $4,791 | $128,300 | $20,800 | $107,500 |
| 2020 | $4,875 | $128,300 | $20,800 | $107,500 |
| 2019 | $4,825 | $128,300 | $20,800 | $107,500 |
| 2018 | $4,738 | $128,300 | $20,800 | $107,500 |
| 2017 | $4,567 | $128,300 | $20,800 | $107,500 |
| 2016 | $4,414 | $128,300 | $20,800 | $107,500 |
| 2015 | $4,245 | $128,300 | $20,800 | $107,500 |
| 2014 | $3,979 | $128,300 | $20,800 | $107,500 |
Source: Public Records
Map
Nearby Homes
Your Personal Tour Guide
Ask me questions while you tour the home.