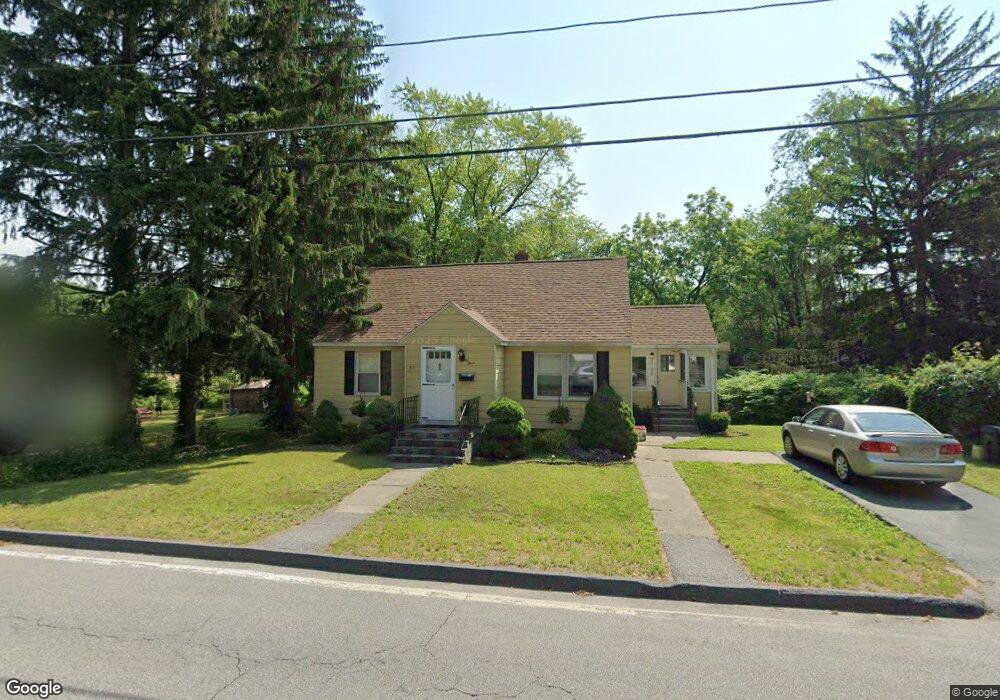
83 Boyce St Auburn, MA 01501
Stoneville NeighborhoodEstimated Value: $324,000 - $404,000
2
Beds
1
Bath
832
Sq Ft
$432/Sq Ft
Est. Value
About This Home
This home is located at 83 Boyce St, Auburn, MA 01501 and is currently estimated at $359,259, approximately $431 per square foot. 83 Boyce St is a home located in Worcester County with nearby schools including Auburn Senior High School, Canterbury Street School, and Shrewsbury Montessori School - Auburn Campus.
Ownership History
Date
Name
Owned For
Owner Type
Purchase Details
Closed on
Aug 28, 2008
Sold by
Est Healy James J and Creamer Richard M
Bought by
Archambault Ellen M
Current Estimated Value
Home Financials for this Owner
Home Financials are based on the most recent Mortgage that was taken out on this home.
Original Mortgage
$153,000
Outstanding Balance
$100,639
Interest Rate
6.29%
Mortgage Type
Purchase Money Mortgage
Estimated Equity
$258,620
Create a Home Valuation Report for This Property
The Home Valuation Report is an in-depth analysis detailing your home's value as well as a comparison with similar homes in the area
Home Values in the Area
Average Home Value in this Area
Purchase History
| Date | Buyer | Sale Price | Title Company |
|---|---|---|---|
| Archambault Ellen M | $170,000 | -- |
Source: Public Records
Mortgage History
| Date | Status | Borrower | Loan Amount |
|---|---|---|---|
| Open | Archambault Ellen M | $153,000 |
Source: Public Records
Tax History
| Year | Tax Paid | Tax Assessment Tax Assessment Total Assessment is a certain percentage of the fair market value that is determined by local assessors to be the total taxable value of land and additions on the property. | Land | Improvement |
|---|---|---|---|---|
| 2025 | $40 | $279,700 | $114,100 | $165,600 |
| 2024 | $3,930 | $263,200 | $108,400 | $154,800 |
| 2023 | $3,852 | $242,600 | $98,500 | $144,100 |
| 2022 | $3,650 | $217,000 | $98,500 | $118,500 |
| 2021 | $3,419 | $188,700 | $86,900 | $101,800 |
| 2020 | $3,389 | $184,600 | $86,900 | $97,700 |
| 2019 | $3,373 | $183,100 | $86,000 | $97,100 |
| 2018 | $3,148 | $170,700 | $80,400 | $90,300 |
| 2017 | $2,993 | $163,200 | $72,900 | $90,300 |
| 2016 | $2,960 | $163,600 | $76,700 | $86,900 |
| 2015 | $2,806 | $162,600 | $76,700 | $85,900 |
| 2014 | $2,730 | $157,900 | $73,000 | $84,900 |
Source: Public Records
Map
Nearby Homes
- 99 Clover St
- 5 Commonwealth Ave
- 177 Boyce St
- 25 Vinal St Unit 28
- 25 Vinal St Unit 26
- 25 Vinal St Unit 29
- 25 Vinal St Unit 30
- 1 Rockland Road Ct
- 204-212 Hampton St
- 177 Oxford St N
- 1034 Southbridge St
- 11 Hulbert Rd Unit 13
- 154 Pakachoag St
- 31-33 Walsh Ave
- 33 Walsh Ave
- 31 Walsh Ave
- 47 Malvern Rd
- 103 Henshaw St
- 40 Bryn Mawr Ave
- 84 Eureka St
Your Personal Tour Guide
Ask me questions while you tour the home.