
Landlord's Agent in 2024
Michele DeRose
RE/MAX
(732) 361-0770
16 in this area
24 Total Sales
Estimated Value: $1,046,000
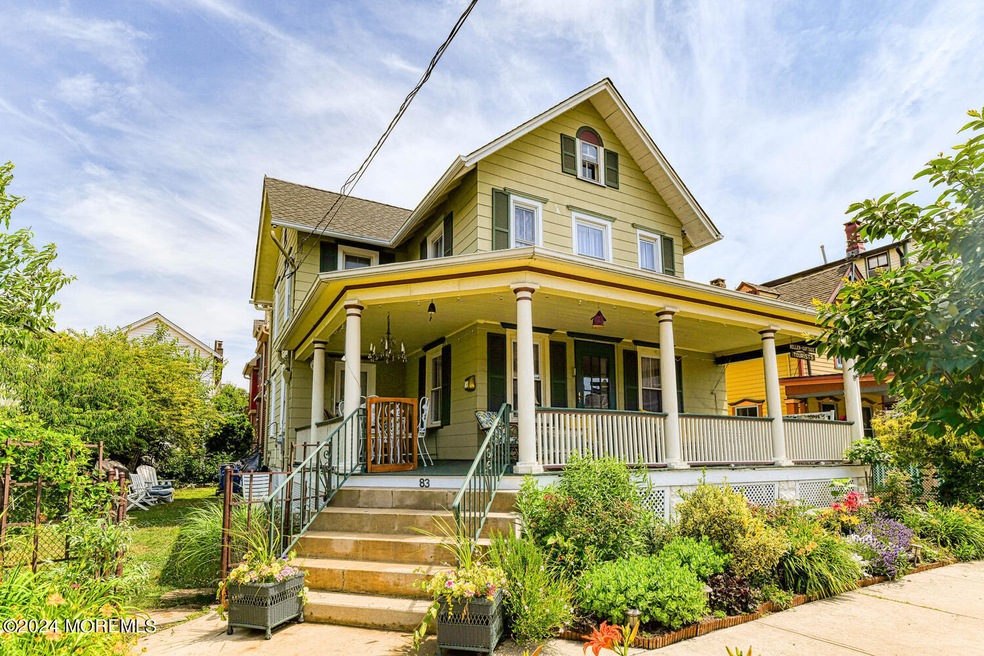
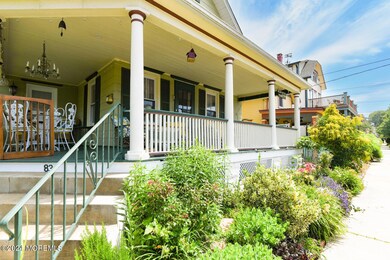
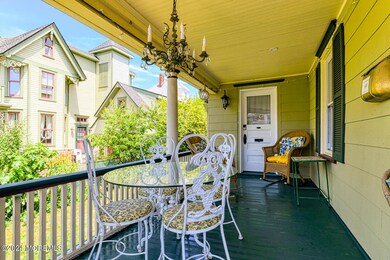
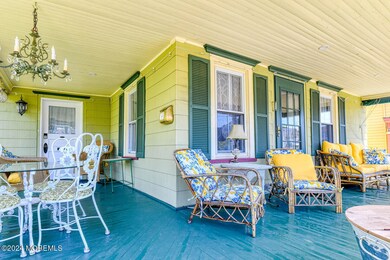
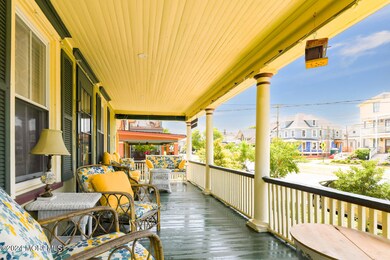
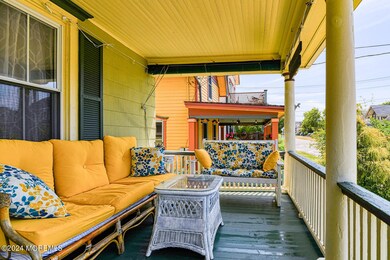
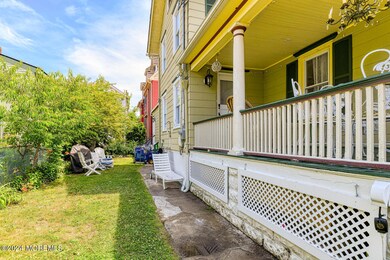
SUMMER WEEKLY RENTAL - New to the Summer Rental Market, fresh off of an extensive remodel, this extraordinary 4 Bedrrom/2.5 Bathroom home has all the comforts of a modern residence while retaining much of the charm that visitors love about Ocean Grove. Come join us for a week or more this summer and spread out across the lovely wrap around open porch, BBQ with family in the fenced in side yard with outdoor shower, and cook up a feast in this gourmet kitchen. Leave your sand and your gear in the large mudroom and head into the living room which will accommodate all your extended family. Family friendly with high chair and pack n play. Also one (1) quiet housebroken dog considered with $200 pet rent. A rare first floor bedroom with Queen bed and en suite bathroom, plus 3 additional bedrooms upstairs with Full, Queen and King Beds await along with a large custom bathroom with separate stall shower and soaker tub. 6 beach badges, beach supplies, central air, & wifi provide everything you need for a great vacation. Just 4.5 blocks from the beach and boardwalk and just 5 blocks to downtown Ocean Grove. Or head over to nearby Asbury Park for live music & more dining options. Sorry no smoking/candles on property. AVAILABLE Weekly or Longer for Fall 2024. $1000 refundable sec dep and $300 cleaning fee.
Last Agent to Rent the Property
RE/MAX Gateway License #1969530 Listed on: 06/23/2024
| Date | Buyer | Sale Price | Title Company |
|---|---|---|---|
| Ferguson William | $105,000 | -- |
| Date | Status | Borrower | Loan Amount |
|---|---|---|---|
| Closed | Ferguson William | $74,000 |
| Date | Event | Price | List to Sale | Price per Sq Ft |
|---|---|---|---|---|
| 09/30/2024 09/30/24 | Rented | $18,500 | +311.1% | -- |
| 06/23/2024 06/23/24 | For Rent | $4,500 | -- | -- |
| Year | Tax Paid | Tax Assessment Tax Assessment Total Assessment is a certain percentage of the fair market value that is determined by local assessors to be the total taxable value of land and additions on the property. | Land | Improvement |
|---|---|---|---|---|
| 2025 | $16,427 | $1,133,000 | $534,100 | $598,900 |
| 2024 | $13,631 | $955,600 | $452,700 | $502,900 |
| 2023 | $13,631 | $768,400 | $504,700 | $263,700 |
| 2022 | $11,824 | $701,300 | $450,200 | $251,100 |
| 2021 | $11,824 | $581,300 | $388,300 | $193,000 |
| 2020 | $11,618 | $557,200 | $374,300 | $182,900 |
| 2019 | $11,535 | $545,900 | $374,300 | $171,600 |
| 2018 | $11,627 | $544,600 | $374,300 | $170,300 |
| 2017 | $11,969 | $537,700 | $380,000 | $157,700 |
| 2016 | $11,513 | $516,300 | $261,900 | $254,400 |
| 2015 | $9,870 | $450,700 | $299,300 | $151,400 |
| 2014 | $11,241 | $421,800 | $224,300 | $197,500 |
Landlord's Agent in 2024
Michele DeRose
RE/MAX
(732) 361-0770
16 in this area
24 Total Sales
Source: MOREMLS (Monmouth Ocean Regional REALTORS®)
MLS Number: 22417715
APN: 35-00243-0000-00009
Disclaimer: Certain information contained herein is derived from information provided by parties other than Homes.com. All information provided is deemed reliable, but is not guaranteed to be accurate and should be independently verified.
![]() IDX information is provided exclusively for personal, non-commercial use, and may not be used for any purpose other than to identify prospective properties consumers may be interested in purchasing.
IDX information is provided exclusively for personal, non-commercial use, and may not be used for any purpose other than to identify prospective properties consumers may be interested in purchasing.
Information is deemed reliable but not guaranteed.