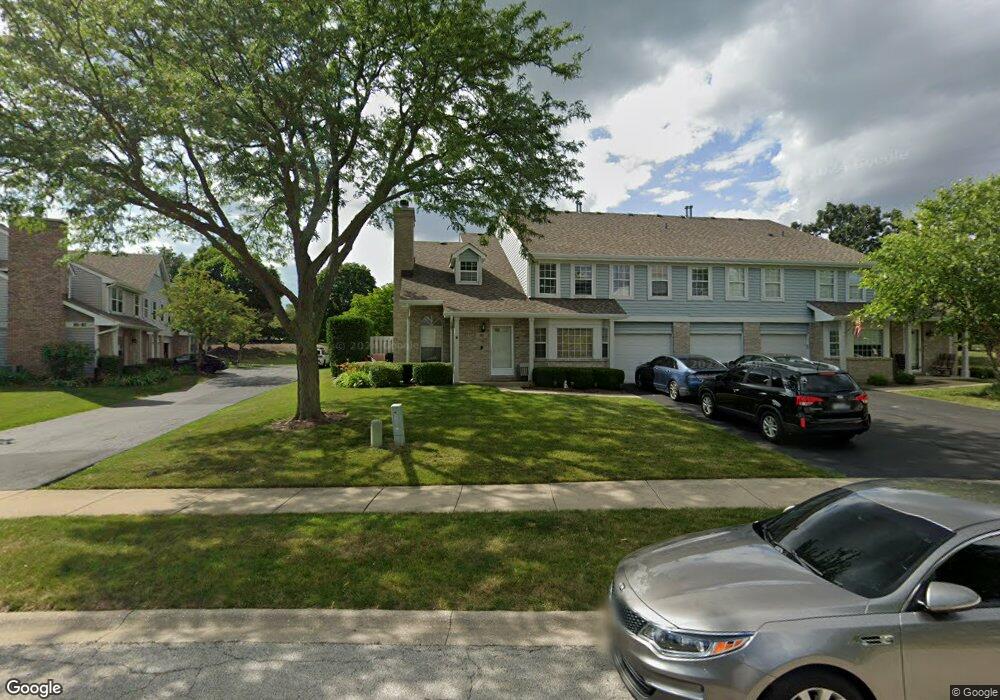
83 Cammeron Ct Aurora, IL 60504
Waubonsie NeighborhoodEstimated Value: $296,000 - $321,000
2
Beds
2
Baths
1,535
Sq Ft
$200/Sq Ft
Est. Value
About This Home
This home is located at 83 Cammeron Ct, Aurora, IL 60504 and is currently estimated at $307,172, approximately $200 per square foot. 83 Cammeron Ct is a home located in DuPage County with nearby schools including McCarty Elementary School, Fischer Middle School, and Waubonsie Valley High School.
Ownership History
Date
Name
Owned For
Owner Type
Purchase Details
Closed on
Jun 1, 2010
Sold by
Breen Sharon and Saltzman Douglas
Bought by
Karkula Bradley A
Current Estimated Value
Home Financials for this Owner
Home Financials are based on the most recent Mortgage that was taken out on this home.
Original Mortgage
$132,941
Outstanding Balance
$91,382
Interest Rate
5.5%
Mortgage Type
FHA
Estimated Equity
$215,790
Purchase Details
Closed on
May 7, 2010
Sold by
North Star Trust Company
Bought by
Breen Sharon and Saltzman Douglas
Home Financials for this Owner
Home Financials are based on the most recent Mortgage that was taken out on this home.
Original Mortgage
$132,941
Outstanding Balance
$91,382
Interest Rate
5.5%
Mortgage Type
FHA
Estimated Equity
$215,790
Purchase Details
Closed on
Mar 12, 1999
Sold by
Saltzman Grace
Bought by
Forest Park National Bank & Trust Co and Trust #99-1119
Purchase Details
Closed on
Nov 20, 1996
Sold by
Bishop Earl J and Bishop Jill L
Bought by
Saltzman Grace
Create a Home Valuation Report for This Property
The Home Valuation Report is an in-depth analysis detailing your home's value as well as a comparison with similar homes in the area
Home Values in the Area
Average Home Value in this Area
Purchase History
| Date | Buyer | Sale Price | Title Company |
|---|---|---|---|
| Karkula Bradley A | $135,000 | Attorneys Title Guaranty Fun | |
| Breen Sharon | -- | None Available | |
| Forest Park National Bank & Trust Co | -- | -- | |
| Saltzman Grace | $116,500 | Plm Title Company |
Source: Public Records
Mortgage History
| Date | Status | Borrower | Loan Amount |
|---|---|---|---|
| Open | Karkula Bradley A | $132,941 |
Source: Public Records
Tax History Compared to Growth
Tax History
| Year | Tax Paid | Tax Assessment Tax Assessment Total Assessment is a certain percentage of the fair market value that is determined by local assessors to be the total taxable value of land and additions on the property. | Land | Improvement |
|---|---|---|---|---|
| 2024 | $5,073 | $74,721 | $19,287 | $55,434 |
| 2023 | $4,806 | $67,140 | $17,330 | $49,810 |
| 2022 | $4,647 | $61,420 | $15,730 | $45,690 |
| 2021 | $4,516 | $59,230 | $15,170 | $44,060 |
| 2020 | $4,571 | $59,230 | $15,170 | $44,060 |
| 2019 | $4,398 | $56,340 | $14,430 | $41,910 |
| 2018 | $3,832 | $49,390 | $13,140 | $36,250 |
| 2017 | $3,758 | $47,710 | $12,690 | $35,020 |
| 2016 | $3,679 | $45,790 | $12,180 | $33,610 |
| 2015 | $3,624 | $43,470 | $11,560 | $31,910 |
| 2014 | $3,512 | $41,250 | $10,790 | $30,460 |
| 2013 | $3,478 | $41,530 | $10,860 | $30,670 |
Source: Public Records
Map
Nearby Homes
- 3016 Anton Dr
- 117 Cammeron Ct
- 2948 Waters Edge Cir
- 72 Heather Glen Dr Unit 72
- 199 N Oakhurst Dr Unit 15W
- 3115 Compton Rd
- 53 Braxton Ln Unit 107W
- 425 Cimarron Dr E Unit 20A
- 133 Heather Glen Dr Unit 133
- 227 Vaughn Rd
- 494 Vaughn Cir
- 75 Saint Croix Ct
- 3140 Medford Ct
- 32w396 Forest Dr
- 305 Cane Garden Cir
- 2460 Millington Ct
- 703 Avondale Ln
- 2924 Shelly Ln
- 3379 Kentshire Cir Unit 33192
- 2942 Shelly Ln Unit 25
- 81 Cammeron Ct
- 85 Cammeron Ct
- 87 Cammeron Ct
- 3018 Anton Dr
- 3018 Anton Dr Unit 1
- 97 Cammeron Ct
- 91 Cammeron Ct Unit 31
- 3024 Anton Dr
- 95 Cammeron Ct
- 3020 Anton Dr
- 3022 Anton Dr
- 93 Cammeron Ct
- 3028 Anton Dr
- 3026 Anton Dr
- 3014 Anton Dr
- 115 Cammeron Ct
- 3030 Anton Dr
- 3032 Anton Dr
- 111 Cammeron Ct
- 113 Cammeron Ct