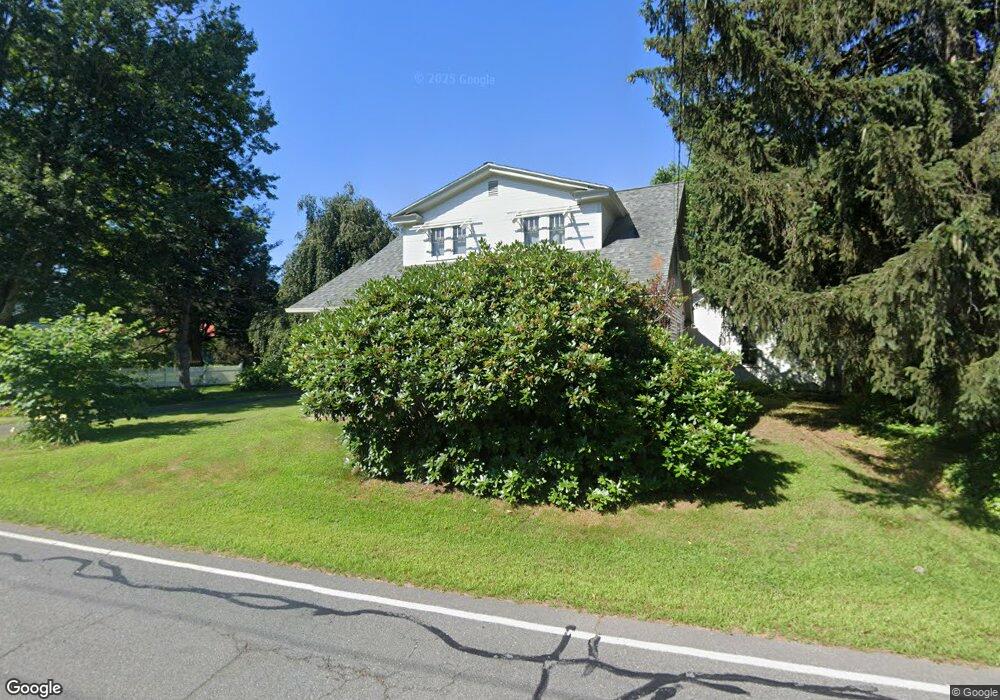
83 Depot Rd Hatfield, MA 01038
Estimated Value: $416,000 - $765,000
3
Beds
2
Baths
2,802
Sq Ft
$202/Sq Ft
Est. Value
About This Home
This home is located at 83 Depot Rd, Hatfield, MA 01038 and is currently estimated at $566,208, approximately $202 per square foot. 83 Depot Rd is a home located in Hampshire County with nearby schools including Hatfield Elementary School and Smith Academy.
Ownership History
Date
Name
Owned For
Owner Type
Purchase Details
Closed on
Nov 1, 1993
Sold by
Kerr James P and Kerr Lisa D
Bought by
Winings Sally E and Toulouhtzis Steven
Current Estimated Value
Home Financials for this Owner
Home Financials are based on the most recent Mortgage that was taken out on this home.
Original Mortgage
$110,000
Interest Rate
6.86%
Mortgage Type
Purchase Money Mortgage
Create a Home Valuation Report for This Property
The Home Valuation Report is an in-depth analysis detailing your home's value as well as a comparison with similar homes in the area
Home Values in the Area
Average Home Value in this Area
Purchase History
| Date | Buyer | Sale Price | Title Company |
|---|---|---|---|
| Winings Sally E | $157,500 | -- |
Source: Public Records
Mortgage History
| Date | Status | Borrower | Loan Amount |
|---|---|---|---|
| Open | Winings Sally E | $117,000 | |
| Closed | Winings Sally E | $70,000 | |
| Closed | Winings Sally E | $10,000 | |
| Closed | Winings Sally E | $110,000 |
Source: Public Records
Tax History
| Year | Tax Paid | Tax Assessment Tax Assessment Total Assessment is a certain percentage of the fair market value that is determined by local assessors to be the total taxable value of land and additions on the property. | Land | Improvement |
|---|---|---|---|---|
| 2025 | $6,123 | $442,426 | $167,626 | $274,800 |
| 2024 | $5,851 | $382,200 | $146,600 | $235,600 |
| 2023 | $4,881 | $362,076 | $138,976 | $223,100 |
| 2022 | $4,636 | $339,158 | $132,258 | $206,900 |
| 2021 | $4,561 | $321,435 | $120,935 | $200,500 |
| 2020 | $4,349 | $321,435 | $120,935 | $200,500 |
| 2019 | $4,098 | $295,030 | $118,730 | $176,300 |
| 2018 | $3,986 | $293,540 | $118,640 | $174,900 |
| 2017 | $3,815 | $288,570 | $118,670 | $169,900 |
| 2016 | $3,780 | $286,816 | $118,616 | $168,200 |
| 2015 | $3,546 | $269,216 | $107,316 | $161,900 |
| 2014 | $3,411 | $269,216 | $107,316 | $161,900 |
Source: Public Records
Map
Nearby Homes
- 59 N Hatfield Rd
- 151 Pantry Rd
- 0 Straits Rd
- 149 Prospect St
- 71 Chestnut St
- 8 Aloha Dr
- 3 Frost Ln
- 58 Main St Unit 4
- 58 Main St Unit 3
- 7 Christian Ln
- 0 North St Unit 73407299
- 6 Shattuck Rd
- 18 Elm St
- 15 S Plain Rd
- Lot 3 Roosevelt St
- 14 Hawley Rd
- 43 Laurel Park Unit 43
- 27 River Dr
- 11 West St
- 32 Stonewall Dr
Your Personal Tour Guide
Ask me questions while you tour the home.