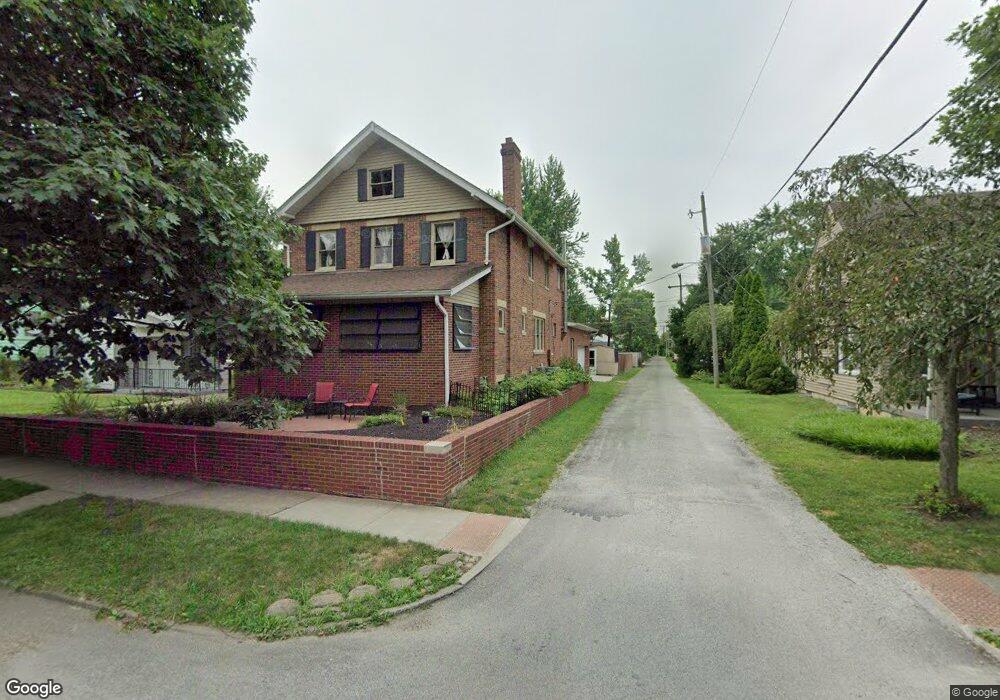
83 E Beaumont Rd Columbus, OH 43214
Clintonville NeighborhoodEstimated Value: $511,000 - $603,125
3
Beds
3
Baths
2,288
Sq Ft
$237/Sq Ft
Est. Value
About This Home
This home is located at 83 E Beaumont Rd, Columbus, OH 43214 and is currently estimated at $542,781, approximately $237 per square foot. 83 E Beaumont Rd is a home located in Franklin County with nearby schools including Indian Springs Elementary School, Dominion Middle School, and Whetstone High School.
Ownership History
Date
Name
Owned For
Owner Type
Purchase Details
Closed on
Jan 3, 2020
Sold by
Schlub David L and Schlub Patrice E
Bought by
Schlub Stella L
Current Estimated Value
Home Financials for this Owner
Home Financials are based on the most recent Mortgage that was taken out on this home.
Original Mortgage
$220,000
Outstanding Balance
$192,703
Interest Rate
3.6%
Mortgage Type
Seller Take Back
Estimated Equity
$350,078
Purchase Details
Closed on
Apr 11, 2011
Sold by
Coffman Ward D and Carol Sue Sprang Trust
Bought by
Schlub David L and Schlub Patrice E
Purchase Details
Closed on
May 31, 2000
Sold by
Sprang Carol S Trust and Kenneth A
Bought by
Sprang Carol S and Carol Sue Sprang Trust
Purchase Details
Closed on
Nov 15, 1996
Sold by
Mccormick Robert N
Bought by
Sprang Ralph A and Sprang Carol S
Home Financials for this Owner
Home Financials are based on the most recent Mortgage that was taken out on this home.
Original Mortgage
$90,000
Interest Rate
8.25%
Mortgage Type
New Conventional
Create a Home Valuation Report for This Property
The Home Valuation Report is an in-depth analysis detailing your home's value as well as a comparison with similar homes in the area
Home Values in the Area
Average Home Value in this Area
Purchase History
| Date | Buyer | Sale Price | Title Company |
|---|---|---|---|
| Schlub Stella L | $220,000 | None Available | |
| Schlub David L | $200,000 | Real Living | |
| Sprang Carol S | -- | -- | |
| Sprang Ralph A | $173,500 | -- |
Source: Public Records
Mortgage History
| Date | Status | Borrower | Loan Amount |
|---|---|---|---|
| Open | Schlub Stella L | $220,000 | |
| Previous Owner | Sprang Ralph A | $90,000 |
Source: Public Records
Tax History
| Year | Tax Paid | Tax Assessment Tax Assessment Total Assessment is a certain percentage of the fair market value that is determined by local assessors to be the total taxable value of land and additions on the property. | Land | Improvement |
|---|---|---|---|---|
| 2025 | $8,165 | $181,930 | $49,560 | $132,370 |
| 2024 | $8,165 | $181,930 | $49,560 | $132,370 |
| 2023 | $8,061 | $181,930 | $49,560 | $132,370 |
| 2022 | $7,944 | $153,160 | $30,030 | $123,130 |
| 2021 | $7,958 | $153,160 | $30,030 | $123,130 |
| 2020 | $8,166 | $153,160 | $30,030 | $123,130 |
| 2019 | $7,337 | $117,990 | $23,100 | $94,890 |
| 2018 | $3,662 | $117,990 | $23,100 | $94,890 |
| 2017 | $7,335 | $117,990 | $23,100 | $94,890 |
| 2016 | $6,597 | $97,100 | $17,190 | $79,910 |
| 2015 | $3,003 | $97,100 | $17,190 | $79,910 |
| 2014 | $6,021 | $97,100 | $17,190 | $79,910 |
| 2013 | $2,828 | $92,470 | $16,380 | $76,090 |
Source: Public Records
Map
Nearby Homes
- 144 Wetmore Rd
- 53 E Beechwold Blvd
- 103 E Jeffrey Place
- 243 E Schreyer Place
- 389 Wetmore Rd
- 62 W Rathbone Ave
- 4938 Fairway Ct Unit 4938-4944
- 122 W Rathbone Ave
- 4464 Zeller Rd
- 5019 N High St Unit 82
- 238 W Henderson Rd
- 4466 Olentangy Blvd
- 325 Starrett Ct
- 4299 Colerain Ave
- 4374 Scenic Dr
- 601 Morse Rd
- 702 E Weisheimer Rd
- 5200 Fenway Ct Unit B
- 82 Blenheim Rd
- 4753 Olentangy River Rd Unit ''B''
- 85 E Beaumont Rd
- 67 E Beaumont Rd
- 87 E Beaumont Rd
- 61 E Beaumont Rd
- 95 E Beaumont Rd
- 55 E Beaumont Rd
- 101 E Beaumont Rd
- 76 Garden Rd
- 82 Garden Rd
- 72 Garden Rd
- 88 Garden Rd
- 47 E Beaumont Rd
- 60 Garden Rd
- 107 E Beaumont Rd
- 94 Garden Rd
- 78 E Beaumont Rd
- 82 E Beaumont Rd
- 54 Garden Rd
- 92 E Beaumont Rd
- 62 E Beaumont Rd
Your Personal Tour Guide
Ask me questions while you tour the home.