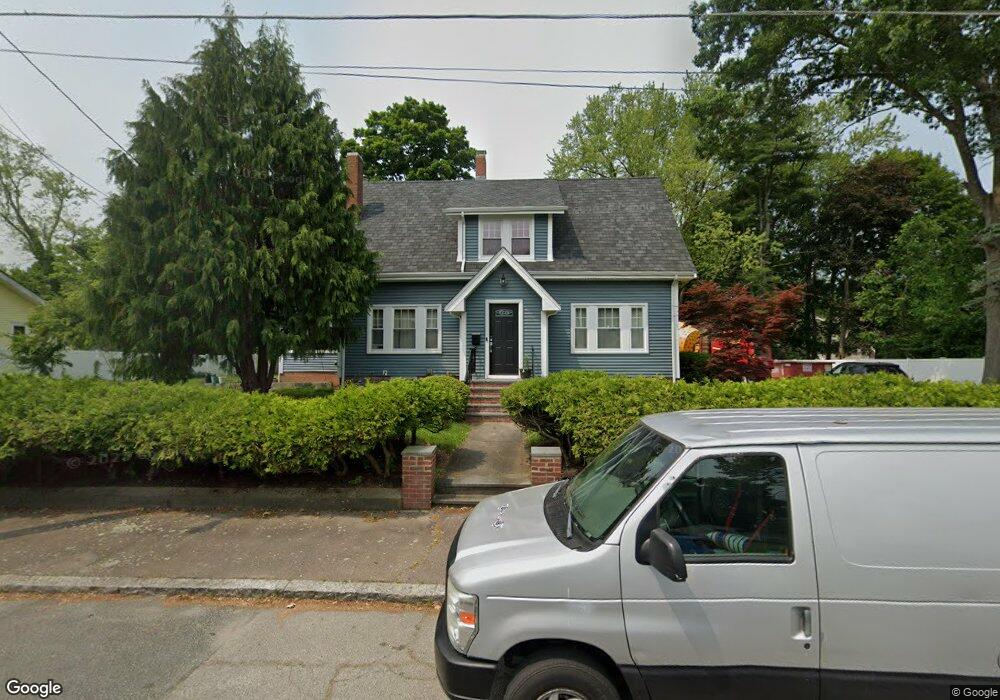
83 Echo St Brockton, MA 02301
Clifton Heights NeighborhoodEstimated Value: $484,000 - $584,000
3
Beds
2
Baths
1,828
Sq Ft
$297/Sq Ft
Est. Value
About This Home
This home is located at 83 Echo St, Brockton, MA 02301 and is currently estimated at $542,740, approximately $296 per square foot. 83 Echo St is a home located in Plymouth County with nearby schools including Gilmore Elementary School, John F. Kennedy Elementary School, and Davis K-8 School.
Ownership History
Date
Name
Owned For
Owner Type
Purchase Details
Closed on
Mar 22, 2006
Sold by
Oconnor Thomas E and Oconnor Mary M
Bought by
Toussaint Jean Marc and Toussaint Elmase N
Current Estimated Value
Home Financials for this Owner
Home Financials are based on the most recent Mortgage that was taken out on this home.
Original Mortgage
$306,000
Outstanding Balance
$174,060
Interest Rate
6.28%
Mortgage Type
Purchase Money Mortgage
Estimated Equity
$368,680
Create a Home Valuation Report for This Property
The Home Valuation Report is an in-depth analysis detailing your home's value as well as a comparison with similar homes in the area
Home Values in the Area
Average Home Value in this Area
Purchase History
| Date | Buyer | Sale Price | Title Company |
|---|---|---|---|
| Toussaint Jean Marc | $306,000 | -- |
Source: Public Records
Mortgage History
| Date | Status | Borrower | Loan Amount |
|---|---|---|---|
| Open | Toussaint Jean Marc | $30,000 | |
| Open | Toussaint Jean Marc | $306,000 |
Source: Public Records
Tax History
| Year | Tax Paid | Tax Assessment Tax Assessment Total Assessment is a certain percentage of the fair market value that is determined by local assessors to be the total taxable value of land and additions on the property. | Land | Improvement |
|---|---|---|---|---|
| 2025 | $5,907 | $487,800 | $142,300 | $345,500 |
| 2024 | $5,772 | $480,200 | $142,300 | $337,900 |
| 2023 | $5,602 | $431,600 | $115,200 | $316,400 |
| 2022 | $4,808 | $344,200 | $104,800 | $239,400 |
| 2021 | $4,801 | $331,100 | $89,500 | $241,600 |
| 2020 | $4,531 | $299,100 | $81,500 | $217,600 |
| 2019 | $4,253 | $273,700 | $78,700 | $195,000 |
| 2018 | $3,793 | $236,200 | $78,700 | $157,500 |
| 2017 | $3,540 | $219,900 | $78,700 | $141,200 |
| 2016 | $3,600 | $207,400 | $77,100 | $130,300 |
| 2015 | $3,276 | $180,500 | $77,100 | $103,400 |
| 2014 | $3,138 | $173,100 | $77,100 | $96,000 |
Source: Public Records
Map
Nearby Homes
Your Personal Tour Guide
Ask me questions while you tour the home.