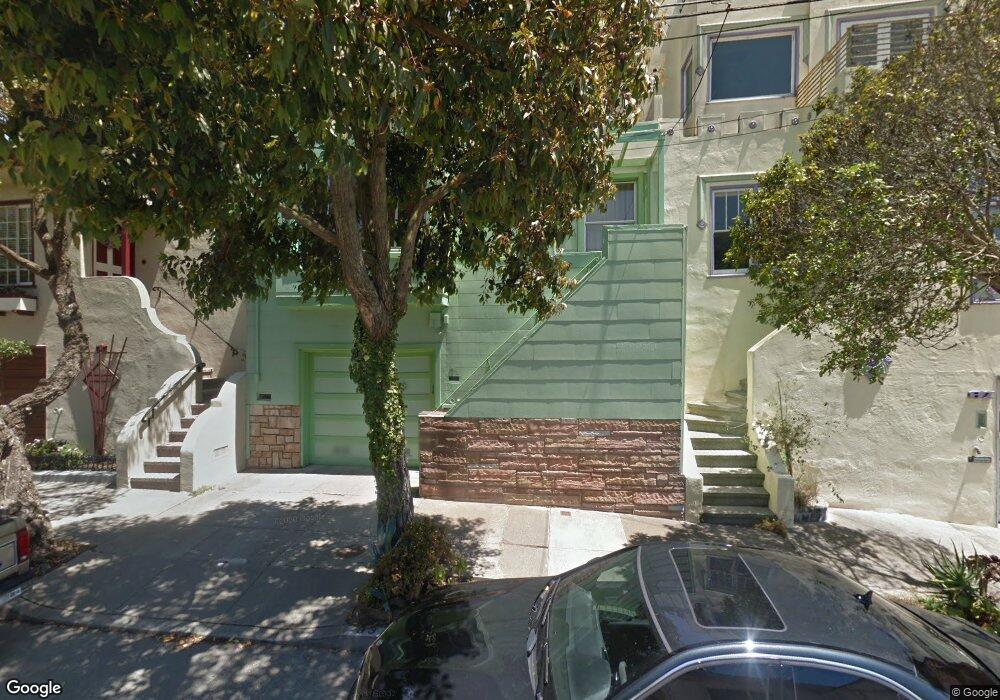
83 Elsie St San Francisco, CA 94110
Bernal Heights NeighborhoodEstimated Value: $1,033,000 - $1,619,000
--
Bed
1
Bath
1,130
Sq Ft
$1,128/Sq Ft
Est. Value
About This Home
This home is located at 83 Elsie St, San Francisco, CA 94110 and is currently estimated at $1,274,281, approximately $1,127 per square foot. 83 Elsie St is a home located in San Francisco County with nearby schools including Leonard R. Flynn Elementary, James Lick Middle School, and Donum Dei Classical Academy.
Ownership History
Date
Name
Owned For
Owner Type
Purchase Details
Closed on
Feb 23, 2018
Sold by
Mckay Kathleen L
Bought by
Mckay Kathleen Leinaala and Kathleen Leinaala Mckay Trust
Current Estimated Value
Purchase Details
Closed on
Nov 1, 2012
Sold by
Mckay Madeline L
Bought by
Mckay Madeline Lokelani
Purchase Details
Closed on
Feb 13, 2001
Sold by
Mckay Madeline L
Bought by
Mckay Madeline L and Mckay Kathleen L
Purchase Details
Closed on
Aug 26, 1998
Sold by
Mckay Montague C and Mckay Madeline L
Bought by
Mckay Montague C and Mckay Madeline L
Purchase Details
Closed on
Sep 5, 1996
Sold by
Mckay Montague C
Bought by
Mckay Montague C and Mckay Madeline L
Create a Home Valuation Report for This Property
The Home Valuation Report is an in-depth analysis detailing your home's value as well as a comparison with similar homes in the area
Home Values in the Area
Average Home Value in this Area
Purchase History
| Date | Buyer | Sale Price | Title Company |
|---|---|---|---|
| Mckay Kathleen Leinaala | -- | None Available | |
| Mckay Madeline Lokelani | -- | None Available | |
| Mckay Madeline L | -- | -- | |
| Mckay Montague C | -- | -- | |
| Mckay Montague C | -- | -- |
Source: Public Records
Tax History Compared to Growth
Tax History
| Year | Tax Paid | Tax Assessment Tax Assessment Total Assessment is a certain percentage of the fair market value that is determined by local assessors to be the total taxable value of land and additions on the property. | Land | Improvement |
|---|---|---|---|---|
| 2025 | $925 | $78,030 | $14,010 | $64,020 |
| 2024 | $925 | $76,502 | $13,736 | $62,766 |
| 2023 | $912 | $75,004 | $13,468 | $61,536 |
| 2022 | $896 | $73,534 | $13,204 | $60,330 |
| 2021 | $881 | $72,094 | $12,946 | $59,148 |
| 2020 | $1,511 | $71,356 | $12,814 | $58,542 |
| 2019 | $1,463 | $69,960 | $12,564 | $57,396 |
| 2018 | $827 | $68,590 | $12,318 | $56,272 |
| 2017 | $817 | $67,248 | $12,078 | $55,170 |
| 2016 | $774 | $65,932 | $11,842 | $54,090 |
| 2015 | $764 | $64,944 | $11,666 | $53,278 |
| 2014 | $1,004 | $63,674 | $11,438 | $52,236 |
Source: Public Records
Map
Nearby Homes
- 31 Coleridge St
- 31-31A Coleridge St
- 166 Bonview St
- 225 Moultrie St
- 15 Heyman Ave
- 252 Coleridge St
- 1651 Treat Ave
- 1350 Shotwell St
- 249 Bocana St
- 255 Bocana St
- 578 San Jose Ave
- 108 Cortland Ave
- 3237 Harrison St
- 3183 Cesar Chavez Unit 1
- 3185 Cesar Chavez Unit 2
- 55-57 Valley St
- 55 Valley St
- 55 Valley St Unit 57
- 3328 26th St
- 3418 26th St Unit 1