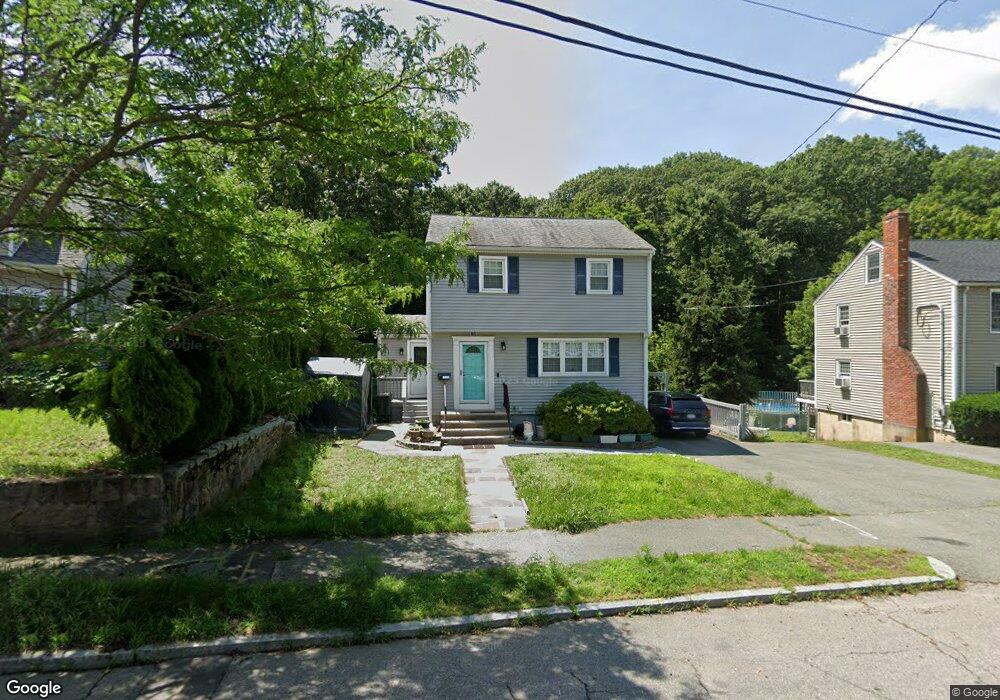
83 Emerald St Quincy, MA 02169
Estimated Value: $770,015 - $952,000
3
Beds
3
Baths
1,630
Sq Ft
$516/Sq Ft
Est. Value
About This Home
This home is located at 83 Emerald St, Quincy, MA 02169 and is currently estimated at $840,754, approximately $515 per square foot. 83 Emerald St is a home located in Norfolk County with nearby schools including Montclair Elementary School, Atlantic Middle School, and North Quincy High School.
Ownership History
Date
Name
Owned For
Owner Type
Purchase Details
Closed on
Jul 14, 2021
Sold by
Perry Anne M and Perry John P
Bought by
Lo Melody
Current Estimated Value
Home Financials for this Owner
Home Financials are based on the most recent Mortgage that was taken out on this home.
Original Mortgage
$430,000
Outstanding Balance
$390,158
Interest Rate
2.9%
Mortgage Type
Purchase Money Mortgage
Estimated Equity
$450,596
Purchase Details
Closed on
Jul 28, 1978
Bought by
Perry John P
Create a Home Valuation Report for This Property
The Home Valuation Report is an in-depth analysis detailing your home's value as well as a comparison with similar homes in the area
Home Values in the Area
Average Home Value in this Area
Purchase History
| Date | Buyer | Sale Price | Title Company |
|---|---|---|---|
| Lo Melody | $630,000 | None Available | |
| Perry John P | -- | -- |
Source: Public Records
Mortgage History
| Date | Status | Borrower | Loan Amount |
|---|---|---|---|
| Open | Lo Melody | $430,000 | |
| Previous Owner | Perry John P | $50,000 |
Source: Public Records
Tax History Compared to Growth
Tax History
| Year | Tax Paid | Tax Assessment Tax Assessment Total Assessment is a certain percentage of the fair market value that is determined by local assessors to be the total taxable value of land and additions on the property. | Land | Improvement |
|---|---|---|---|---|
| 2025 | $7,865 | $682,100 | $327,800 | $354,300 |
| 2024 | $7,440 | $660,200 | $313,000 | $347,200 |
| 2023 | $6,906 | $620,500 | $298,900 | $321,600 |
| 2022 | $5,831 | $486,700 | $242,200 | $244,500 |
| 2021 | $5,799 | $477,700 | $242,200 | $235,500 |
| 2020 | $5,727 | $460,700 | $242,200 | $218,500 |
| 2019 | $5,571 | $443,900 | $235,700 | $208,200 |
| 2018 | $5,491 | $411,600 | $219,400 | $192,200 |
| 2017 | $5,436 | $383,600 | $209,700 | $173,900 |
| 2016 | $5,104 | $355,400 | $192,100 | $163,300 |
| 2015 | $4,841 | $331,600 | $182,100 | $149,500 |
| 2014 | $4,786 | $322,100 | $182,100 | $140,000 |
Source: Public Records
Map
Nearby Homes
- 111 Shawmut St
- 29 Oconnell Ave
- 64 Shawmut St
- 66 Unity St
- 46 Century Ln
- 41 Wallace Rd
- 60 Pond St
- 73 Connell St
- 418 Pleasant St
- 52 Bunker Hill Ln
- 10 White St
- 510 Willard St
- 639 Pleasant St Unit 639
- 639 Pleasant St
- 397 Adams St
- 211 Copeland St
- 11 Rockwell Ave
- 400 Adams St Unit A
- 400 Adams St Unit B
- 63 Adele Rd