Estimated Value: $265,000 - $298,000
3
Beds
1
Bath
1,092
Sq Ft
$263/Sq Ft
Est. Value
About This Home
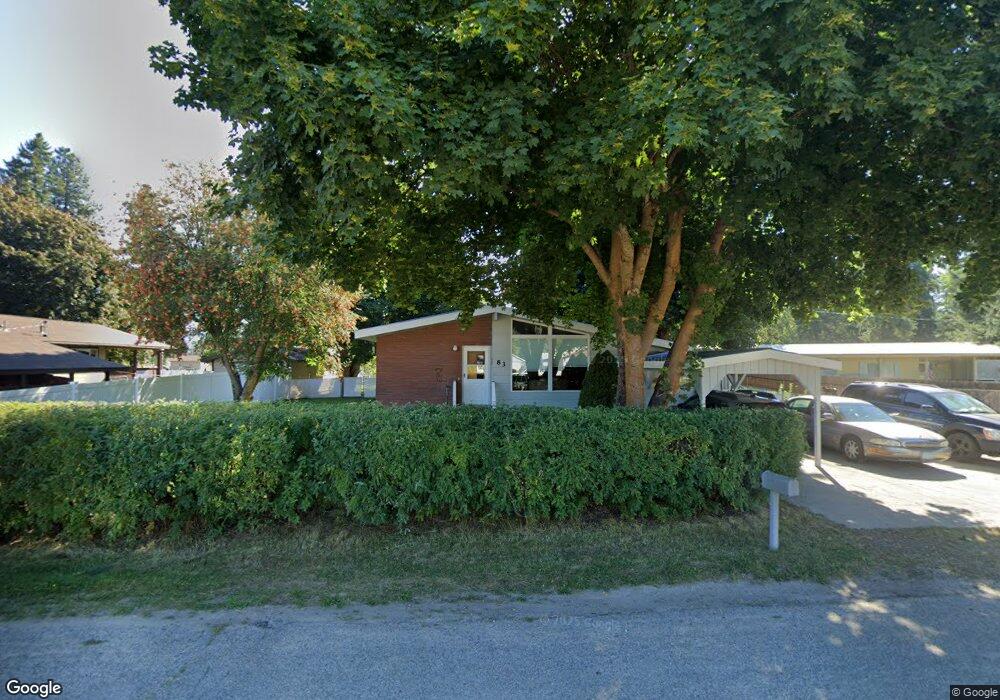
This home is located at 83 Glenwood Ln, Libby, MT 59923 and is currently estimated at $286,667, approximately $262 per square foot. 83 Glenwood Ln is a home located in Lincoln County with nearby schools including Libby Elementary School, Libby High School, and Kootenai Valley Christian School.
Ownership History
Date
Name
Owned For
Owner Type
Purchase Details
Closed on
Mar 12, 2025
Sold by
Richards Lana M
Bought by
Richards Patrick S and Richards Lana M
Current Estimated Value
Home Financials for this Owner
Home Financials are based on the most recent Mortgage that was taken out on this home.
Original Mortgage
$1
Outstanding Balance
$1
Interest Rate
13%
Mortgage Type
Reverse Mortgage Home Equity Conversion Mortgage
Purchase Details
Closed on
Jul 28, 2024
Sold by
Beasley Gloria
Bought by
Richards Lana
Purchase Details
Closed on
Aug 12, 2021
Sold by
Gloria Beasley
Bought by
Richards Patrick and Richards Lana
Purchase Details
Closed on
Mar 1, 2017
Sold by
Wilmington Savings Fund Society Fsb
Bought by
Beasley Gloria and Richards Lana M
Create a Home Valuation Report for This Property
The Home Valuation Report is an in-depth analysis detailing your home's value as well as a comparison with similar homes in the area
Home Values in the Area
Average Home Value in this Area
Purchase History
| Date | Buyer | Sale Price | Title Company |
|---|---|---|---|
| Richards Patrick S | -- | Atlas Title Company | |
| Richards Patrick S | -- | Atlas Title Company | |
| Richards Lana | -- | None Listed On Document | |
| Richards Patrick | -- | None Listed On Document | |
| Beasley Gloria | $62,000 | None Available | |
| Wilmington Savings Dund Society Fsb | -- | None Available |
Source: Public Records
Mortgage History
| Date | Status | Borrower | Loan Amount |
|---|---|---|---|
| Open | Richards Patrick S | $1 | |
| Open | Richards Patrick S | $426,000 | |
| Closed | Richards Patrick S | $426,000 |
Source: Public Records
Tax History
| Year | Tax Paid | Tax Assessment Tax Assessment Total Assessment is a certain percentage of the fair market value that is determined by local assessors to be the total taxable value of land and additions on the property. | Land | Improvement |
|---|---|---|---|---|
| 2025 | $621 | $241,900 | $0 | $0 |
| 2024 | $248 | $221,300 | $0 | $0 |
| 2023 | $1,551 | $221,300 | $0 | $0 |
| 2022 | $955 | $150,700 | $0 | $0 |
| 2021 | $1,189 | $150,700 | $0 | $0 |
| 2020 | $1,133 | $126,100 | $0 | $0 |
| 2019 | $1,125 | $126,100 | $0 | $0 |
| 2018 | $941 | $100,200 | $0 | $0 |
| 2017 | $1,009 | $128,900 | $0 | $0 |
| 2016 | $1,379 | $99,000 | $0 | $0 |
| 2015 | $122 | $99,000 | $0 | $0 |
| 2014 | $600 | $70,119 | $0 | $0 |
Source: Public Records
Map
Nearby Homes
- Tbd, Lot 5 Parmenter Dr
- Tbd, Lot 1 Parmenter Dr
- Tbd, Lot 3 Parmenter Rd
- Tbd, Lot 2 Parmenter Rd
- Tbd, Lot 4 Parmenter Rd
- 335 Mahoney Rd
- 917 Croteau Rd
- 31901 U S 2
- 1120 Nevada Ave
- 1507 Custer Ave
- 223 E Commerce Way Unit 14
- 1009 Idaho Ave
- 188 Parmenter Ave
- 601 W 4th St
- 36811 U S Highway 2
- 62264 U S Highway 2
- NHN U S Highway 2
- 516 W 4th St
- Nhn Montana 37
- 1511 Main Ave
Your Personal Tour Guide
Ask me questions while you tour the home.