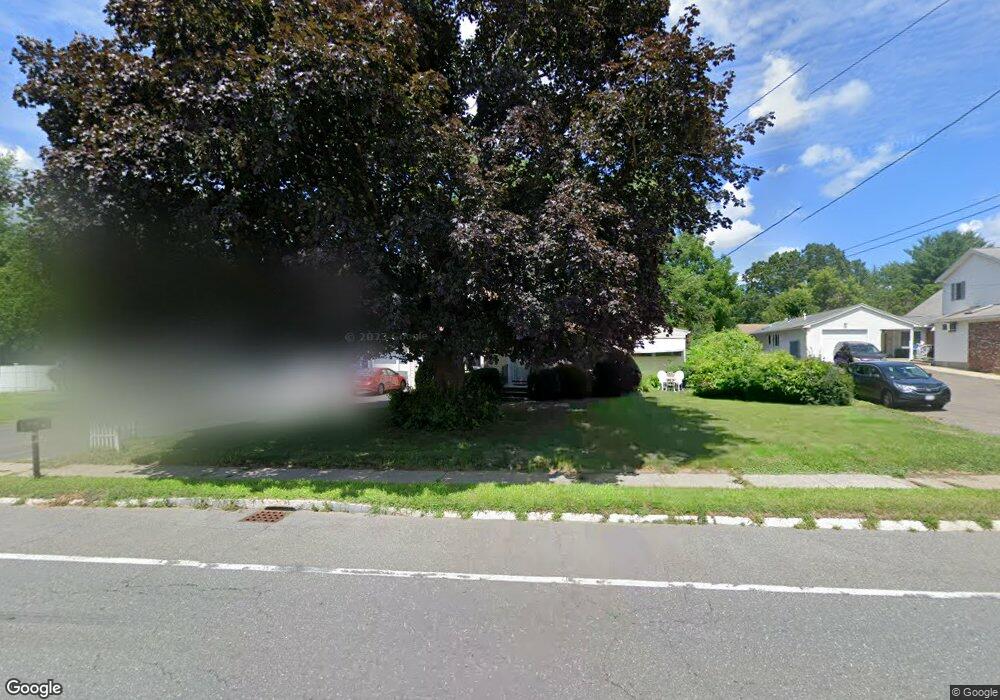
83 Granby Rd South Hadley, MA 01075
Estimated Value: $328,000 - $357,184
3
Beds
2
Baths
1,350
Sq Ft
$257/Sq Ft
Est. Value
About This Home
This home is located at 83 Granby Rd, South Hadley, MA 01075 and is currently estimated at $346,796, approximately $256 per square foot. 83 Granby Rd is a home located in Hampshire County with nearby schools including Plains Elementary School, Mosier Elementary School, and Michael E. Smith Middle School.
Ownership History
Date
Name
Owned For
Owner Type
Purchase Details
Closed on
Jan 21, 2000
Sold by
M Nelson Homberg Jr T and Spaudling Carol
Bought by
Kites Susan
Current Estimated Value
Home Financials for this Owner
Home Financials are based on the most recent Mortgage that was taken out on this home.
Original Mortgage
$104,900
Interest Rate
7.84%
Mortgage Type
Purchase Money Mortgage
Create a Home Valuation Report for This Property
The Home Valuation Report is an in-depth analysis detailing your home's value as well as a comparison with similar homes in the area
Home Values in the Area
Average Home Value in this Area
Purchase History
| Date | Buyer | Sale Price | Title Company |
|---|---|---|---|
| Kites Susan | $105,000 | -- |
Source: Public Records
Mortgage History
| Date | Status | Borrower | Loan Amount |
|---|---|---|---|
| Open | Kites Susan | $25,000 | |
| Open | Kites Susan | $102,724 | |
| Closed | Kites Susan | $104,900 | |
| Closed | Kites Susan | $150,000 |
Source: Public Records
Tax History Compared to Growth
Tax History
| Year | Tax Paid | Tax Assessment Tax Assessment Total Assessment is a certain percentage of the fair market value that is determined by local assessors to be the total taxable value of land and additions on the property. | Land | Improvement |
|---|---|---|---|---|
| 2025 | $4,331 | $271,900 | $95,300 | $176,600 |
| 2024 | $4,347 | $261,100 | $89,200 | $171,900 |
| 2023 | $4,147 | $236,300 | $80,900 | $155,400 |
| 2022 | $3,977 | $215,200 | $80,900 | $134,300 |
| 2021 | $3,923 | $201,600 | $75,500 | $126,100 |
| 2020 | $3,767 | $188,900 | $75,500 | $113,400 |
| 2019 | $3,645 | $180,900 | $72,000 | $108,900 |
| 2018 | $3,500 | $175,600 | $69,700 | $105,900 |
| 2017 | $3,378 | $167,900 | $69,700 | $98,200 |
| 2016 | $3,317 | $167,100 | $69,700 | $97,400 |
| 2015 | $3,145 | $162,300 | $67,700 | $94,600 |
Source: Public Records
Map
Nearby Homes
- 133 Granby Rd
- 0 Granby Rd
- 35 Ludlow Rd
- 118 Willimansett St
- 5 Marion St
- 50 Bardwell St
- 41 Susan Ave
- 18 Susan Ave
- 70 Lathrop St
- 2085 Memorial Dr
- 25 Maple St
- 62 Old Lyman Rd
- 35 Yale St
- 126 Stonybrook Way
- 27 Fulton St
- 85 Fairview St
- 311 Montcalm St
- 17 Yorktown Ct
- 41 W Summit St Unit 55
- 41 W Summit St Unit 38