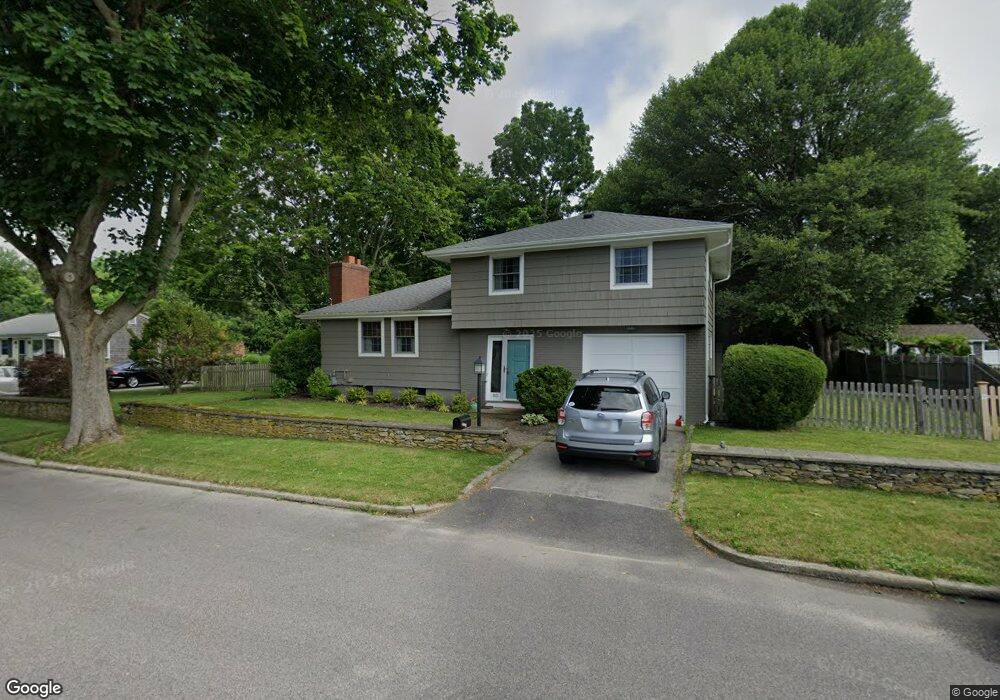
83 Greylock Rd Bristol, RI 02809
Bristol Highlands NeighborhoodEstimated Value: $481,725 - $653,000
3
Beds
2
Baths
1,404
Sq Ft
$428/Sq Ft
Est. Value
About This Home
This home is located at 83 Greylock Rd, Bristol, RI 02809 and is currently estimated at $600,431, approximately $427 per square foot. 83 Greylock Rd is a home located in Bristol County with nearby schools including Mt. Hope High School, Highlander Charter Middle and High School, and Our Lady of Mt. Carmel School.
Ownership History
Date
Name
Owned For
Owner Type
Purchase Details
Closed on
Jan 3, 2019
Sold by
Pease William M and Pease Marilyn L
Bought by
William M Jr & M L Pease Lt
Current Estimated Value
Purchase Details
Closed on
Mar 5, 2004
Sold by
Roderick Elaine
Bought by
Pease William and Pease Marilyn
Create a Home Valuation Report for This Property
The Home Valuation Report is an in-depth analysis detailing your home's value as well as a comparison with similar homes in the area
Home Values in the Area
Average Home Value in this Area
Purchase History
| Date | Buyer | Sale Price | Title Company |
|---|---|---|---|
| William M Jr & M L Pease Lt | -- | -- | |
| Pease William | $312,000 | -- |
Source: Public Records
Mortgage History
| Date | Status | Borrower | Loan Amount |
|---|---|---|---|
| Previous Owner | Pease William | $160,000 | |
| Previous Owner | Pease William | $145,000 | |
| Previous Owner | Pease William | $120,000 |
Source: Public Records
Tax History
| Year | Tax Paid | Tax Assessment Tax Assessment Total Assessment is a certain percentage of the fair market value that is determined by local assessors to be the total taxable value of land and additions on the property. | Land | Improvement |
|---|---|---|---|---|
| 2025 | $3,317 | $240,000 | $86,300 | $153,700 |
| 2024 | $3,317 | $240,000 | $86,300 | $153,700 |
| 2023 | $3,206 | $240,000 | $86,300 | $153,700 |
| 2022 | $3,120 | $240,000 | $86,300 | $153,700 |
| 2021 | $3,737 | $259,900 | $141,800 | $118,100 |
| 2020 | $3,657 | $259,900 | $141,800 | $118,100 |
| 2019 | $3,566 | $259,900 | $141,800 | $118,100 |
| 2018 | $4,117 | $267,700 | $142,800 | $124,900 |
| 2017 | $3,739 | $250,600 | $129,000 | $121,600 |
| 2016 | $3,628 | $245,600 | $129,000 | $116,600 |
| 2015 | $3,376 | $240,600 | $129,000 | $111,600 |
| 2014 | $2,727 | $208,830 | $102,600 | $106,230 |
Source: Public Records
Map
Nearby Homes
Your Personal Tour Guide
Ask me questions while you tour the home.