Estimated Value: $139,000 - $255,000
2
Beds
1
Bath
936
Sq Ft
$213/Sq Ft
Est. Value
About This Home
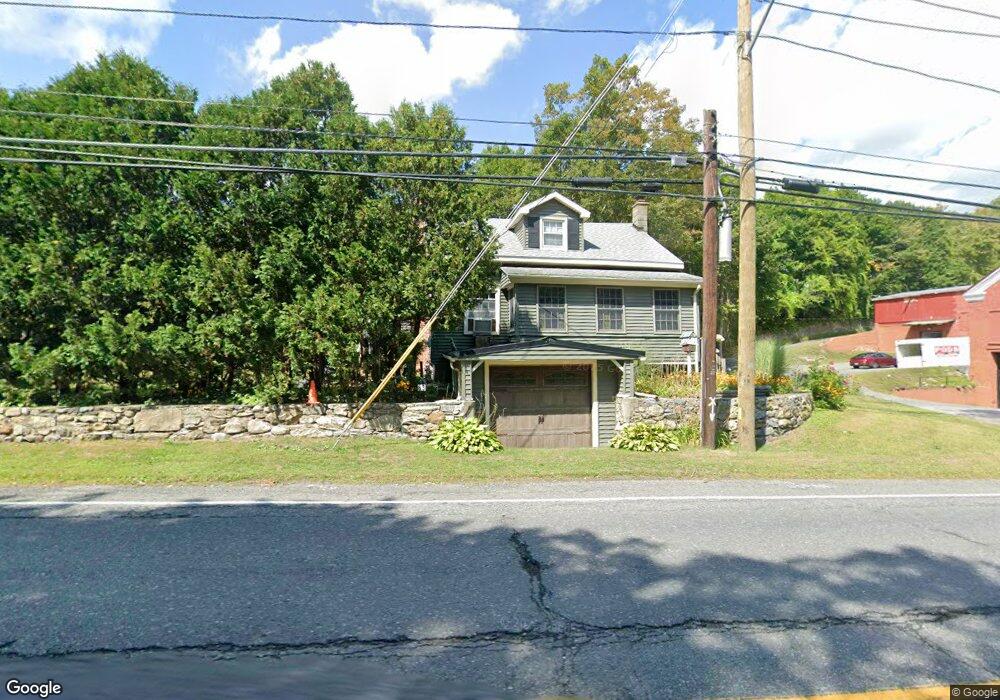
This home is located at 83 Grove St, Adams, MA 01220 and is currently estimated at $199,098, approximately $212 per square foot. 83 Grove St is a home located in Berkshire County with nearby schools including Hoosac Valley Middle & High School, Berkshire Arts & Technology Charter Public School, and St. Stanislaus Kostka School.
Ownership History
Date
Name
Owned For
Owner Type
Purchase Details
Closed on
May 20, 2021
Sold by
Schafler Celia
Bought by
Bond Troy
Current Estimated Value
Home Financials for this Owner
Home Financials are based on the most recent Mortgage that was taken out on this home.
Original Mortgage
$319,500
Outstanding Balance
$289,547
Interest Rate
3.1%
Mortgage Type
Purchase Money Mortgage
Estimated Equity
-$90,449
Purchase Details
Closed on
Apr 9, 2015
Sold by
Schafler Anita Est
Bought by
Schafler Celia
Create a Home Valuation Report for This Property
The Home Valuation Report is an in-depth analysis detailing your home's value as well as a comparison with similar homes in the area
Home Values in the Area
Average Home Value in this Area
Purchase History
| Date | Buyer | Sale Price | Title Company |
|---|---|---|---|
| Bond Troy | $355,000 | None Available | |
| Schafler Celia | -- | -- |
Source: Public Records
Mortgage History
| Date | Status | Borrower | Loan Amount |
|---|---|---|---|
| Open | Bond Troy | $319,500 |
Source: Public Records
Tax History Compared to Growth
Tax History
| Year | Tax Paid | Tax Assessment Tax Assessment Total Assessment is a certain percentage of the fair market value that is determined by local assessors to be the total taxable value of land and additions on the property. | Land | Improvement |
|---|---|---|---|---|
| 2025 | $2,939 | $172,800 | $43,100 | $129,700 |
| 2024 | $2,775 | $158,200 | $40,400 | $117,800 |
| 2023 | $2,614 | $140,900 | $37,200 | $103,700 |
| 2022 | $2,561 | $122,600 | $32,300 | $90,300 |
| 2021 | $2,213 | $111,200 | $32,300 | $78,900 |
| 2020 | $1,735 | $110,500 | $32,400 | $78,100 |
| 2019 | $1,745 | $110,500 | $32,400 | $78,100 |
| 2018 | $2,423 | $109,100 | $32,400 | $76,700 |
| 2017 | $1,645 | $109,100 | $32,400 | $76,700 |
| 2016 | $2,113 | $98,800 | $32,400 | $66,400 |
| 2015 | $2,079 | $97,300 | $34,100 | $63,200 |
| 2014 | $1,941 | $97,300 | $34,100 | $63,200 |
Source: Public Records
Map
Nearby Homes
- 52 Alger St
- 9 Pinnacle Point
- 21 Overlook Terrace
- 219 West Rd
- 10 Enterprise St
- 50 Commercial St
- 34-36 Crandall St
- 4 Edmunds St Unit A101
- 29 Crandall St
- 6 Crandall St
- 46 E Orchard Terrace
- 17 Morningside Ave
- 30 Summer St
- 2 Melrose St
- 71 Park St Unit 75
- 3 Melrose St
- 5 Richmond St
- 27 2nd St
- 2 Valley St
- 9 Beecher St
- 80-84 Grove St
- 0 Grove St
- 80 Grove St Unit 84
- 88 Grove St
- 87 Grove St
- 91-93 Grove
- 2 Phillips Hill
- 10 Phillips Hill
- 69 Grove St
- 99 Grove St
- 12 Phillips Hill
- 14 Phillips Hill
- 56 Wilbur Ln
- 79 Quality St
- 59 Quality St
- 57 Quality St
- 53 Quality St Unit 55
- 111 Grove St Unit 113
- 0 Quality St
- 19 Quality St Unit 1