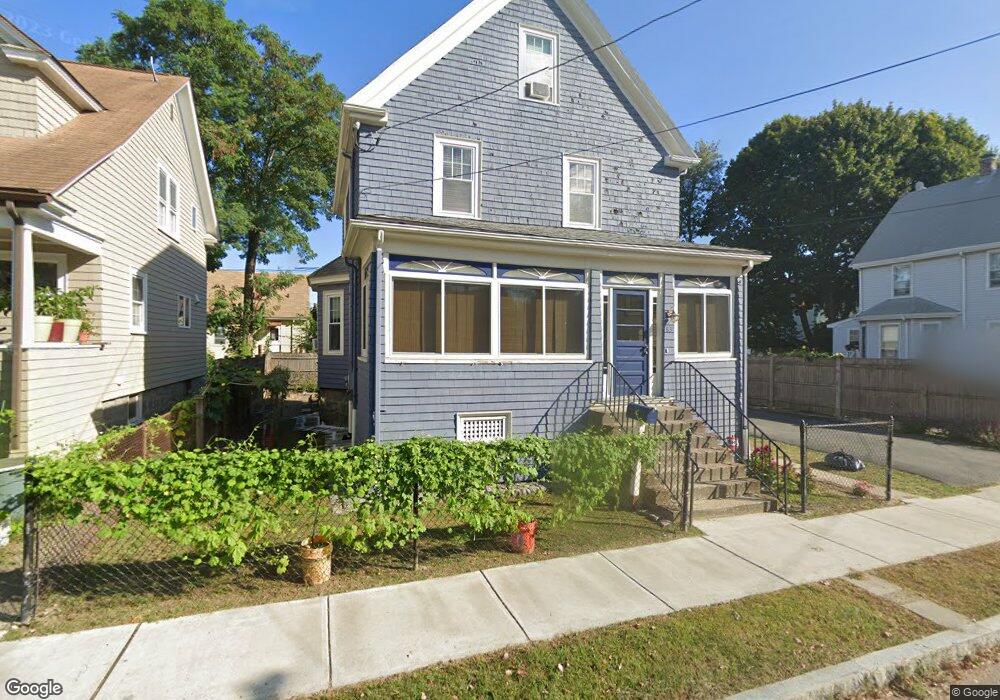
83 Hamilton St Quincy, MA 02170
North Quincy NeighborhoodEstimated Value: $753,954 - $863,000
4
Beds
2
Baths
1,554
Sq Ft
$522/Sq Ft
Est. Value
About This Home
This home is located at 83 Hamilton St, Quincy, MA 02170 and is currently estimated at $810,989, approximately $521 per square foot. 83 Hamilton St is a home located in Norfolk County with nearby schools including Beechwood Knoll Elementary School, Atlantic Middle School, and North Quincy High School.
Ownership History
Date
Name
Owned For
Owner Type
Purchase Details
Closed on
May 27, 2016
Sold by
Ly Yinying F and Fang Rongfeng
Bought by
Ly Yinying F
Current Estimated Value
Purchase Details
Closed on
Mar 26, 2013
Sold by
Sherman Adriane B and Okeefe Michael E
Bought by
Ly Yinying F and Fang Rongfeng
Home Financials for this Owner
Home Financials are based on the most recent Mortgage that was taken out on this home.
Original Mortgage
$300,000
Interest Rate
3.57%
Mortgage Type
New Conventional
Purchase Details
Closed on
Jun 1, 2005
Sold by
Ryan Joseph G
Bought by
Sherman Adriane B and Okeefe Michael E
Home Financials for this Owner
Home Financials are based on the most recent Mortgage that was taken out on this home.
Original Mortgage
$333,000
Interest Rate
5.83%
Mortgage Type
Purchase Money Mortgage
Purchase Details
Closed on
Jan 4, 2005
Sold by
Farrell Elaine C and Macdonald Marjorie F
Bought by
Ryan Joseph G
Create a Home Valuation Report for This Property
The Home Valuation Report is an in-depth analysis detailing your home's value as well as a comparison with similar homes in the area
Home Values in the Area
Average Home Value in this Area
Purchase History
| Date | Buyer | Sale Price | Title Company |
|---|---|---|---|
| Ly Yinying F | -- | -- | |
| Ly Yinying F | $383,000 | -- | |
| Sherman Adriane B | $423,000 | -- | |
| Ryan Joseph G | $315,000 | -- |
Source: Public Records
Mortgage History
| Date | Status | Borrower | Loan Amount |
|---|---|---|---|
| Previous Owner | Ly Yinying F | $300,000 | |
| Previous Owner | Sherman Adriane B | $333,000 |
Source: Public Records
Tax History
| Year | Tax Paid | Tax Assessment Tax Assessment Total Assessment is a certain percentage of the fair market value that is determined by local assessors to be the total taxable value of land and additions on the property. | Land | Improvement |
|---|---|---|---|---|
| 2025 | $7,461 | $647,100 | $324,500 | $322,600 |
| 2024 | $7,222 | $640,800 | $324,500 | $316,300 |
| 2023 | $6,723 | $604,000 | $309,100 | $294,900 |
| 2022 | $6,257 | $522,300 | $247,300 | $275,000 |
| 2021 | $6,222 | $512,500 | $247,300 | $265,200 |
| 2020 | $6,119 | $492,300 | $247,300 | $245,000 |
| 2019 | $5,748 | $458,000 | $231,100 | $226,900 |
| 2018 | $5,539 | $415,200 | $210,100 | $205,100 |
| 2017 | $5,677 | $400,600 | $210,100 | $190,500 |
| 2016 | $5,284 | $368,000 | $191,000 | $177,000 |
| 2015 | $4,904 | $335,900 | $173,600 | $162,300 |
| 2014 | $4,449 | $299,400 | $165,300 | $134,100 |
Source: Public Records
Map
Nearby Homes
- 28 Apthorp St
- 11 Gould St
- 10 W Elm Ave
- 27 Herbert Rd
- 20 Ellington Rd
- 9 Chick St
- 19 Bass St
- 10 Weston Ave Unit 322
- 135 E Squantum St
- 85 E Squantum St Unit 10
- 297 Billings St
- 17 Holmes St Unit 204
- 17 Holmes St Unit 2
- 17 Holmes St Unit 1
- 107 Fayette St
- 201 Billings St
- 271 Atlantic St
- 98 Safford St
- 267-269 Farrington St
- 100 W Squantum St Unit 411
Your Personal Tour Guide
Ask me questions while you tour the home.